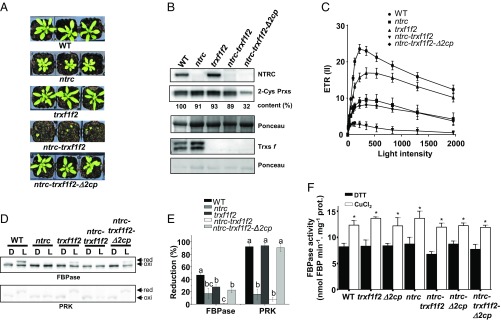
Fig. 4.
Decreased levels of 2-Cys Prxs suppress the growth inhibition phenotype of the ntrc-trxf1f2 mutant. (A) WT and mutant lines were grown under long-day conditions for 4 wk. (B) Western blot analysis of the content of NTRC, 2-Cys Prxs, and Trxs f in WT and mutant lines grown as stated in A. Band intensities of 2-Cys Prxs and Ponceau were quantified (ScionImage), and the ratios between them in reference to the WT sample (arbitrarily assigned a value of 100) are indicated. (C) Relative ETRs of PSII, ETR(II), were determined during stepwise increasing PAR in plants grown as in A. Each data point is the mean of the ETR(II) from at least five leaves from different plants, and SEs are presented. (D) In vivo redox state of FBPase and PRK was monitored at the end of the dark period (marked as “D”) or after 30 min of illumination at 125 μE m−2⋅s−1 (“L”) using plants grown as in A. (E) Band intensities were quantified (ScionImage), and the percentage of reduction for each enzyme is the ratio between the reduced form and the sum of reduced and oxidized forms. Each value is the mean of five independent experiments ± SE. Letters indicate significant differences between mutants by Student’s t test at a 95% CI. oxi, oxidized; red, reduced. (F) FBPase activity was assayed in leaf extracts, pretreated with 100 µM CuCl2 (black bars) or 10 mM DTT (white bars), from plants grown as described in A and harvested at 12 h of the day period. Results are the mean ± SE from three biological replicates. For each genotype, asterisks indicate significant differences (Student’s t test at a 95% CI) between oxidant and reducing conditions.

