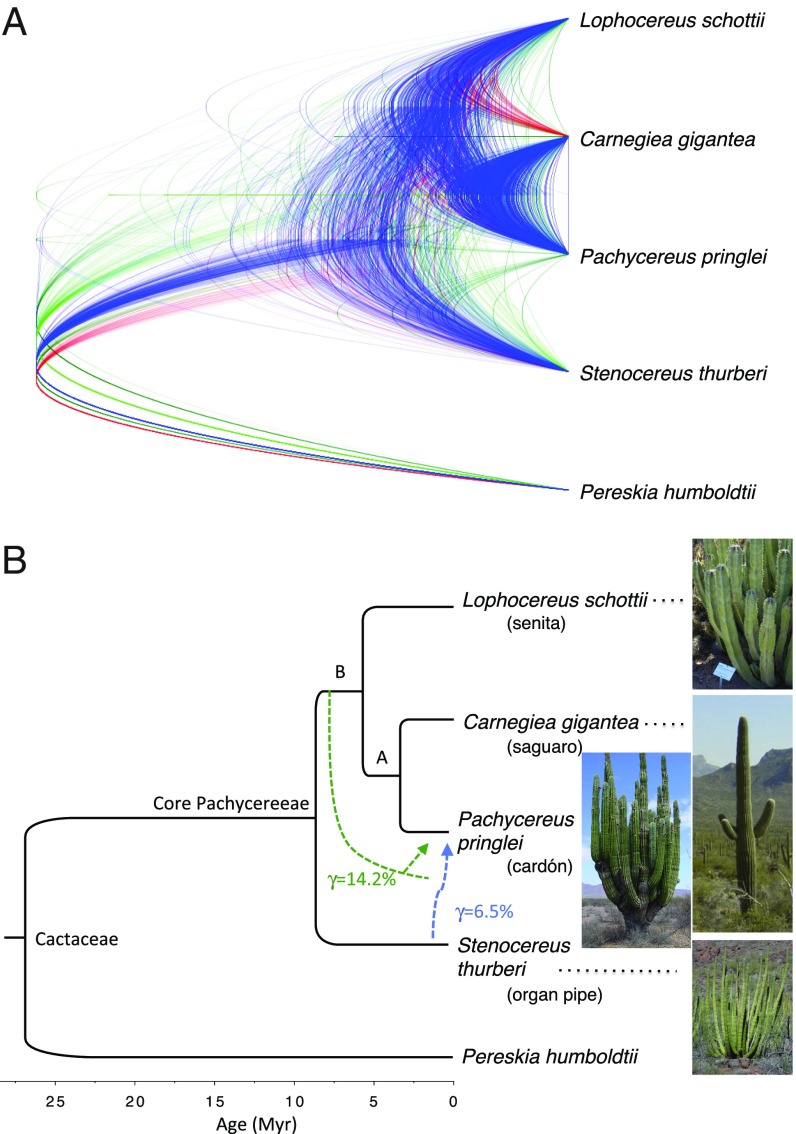
Fig. 2.
(A) Topological discordance in the 90% gene confidence set of 458 gene trees visualized in DensiTree (78). Blue trees are the most frequent, followed by red and shades of green. (B) Species tree inferred with BPP and MP-EST, which was the same for all gene sets, with divergence times estimated using the Neutral partition. Blue dashed line indicates reticulation, having inferred inheritance probability, γ, on the optimal PhyloNet analysis of the same set of gene trees. Green dashed line indicates position of reticulation on the next best inferred network (Fig. S1). The origin of this reticulation edge earlier than its endpoint implies the existence of an extinct or unsampled taxon.

