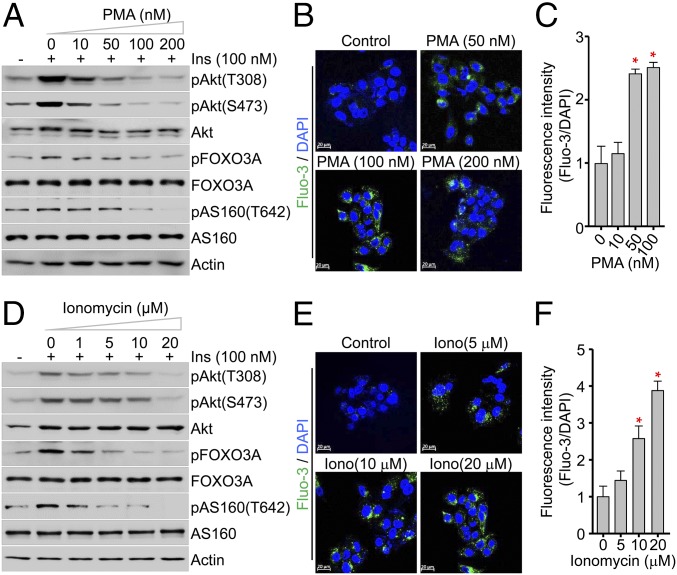
Fig. 2.
The catalytic activity of Akt is modulated by intracellular Ca2+ concentration. (A and D) Immunoblot analysis of the phosphorylation states of Akt, FOXO3A, and AS160, and the total amounts of the indicated proteins in HepG2 cells. Cells were incubated for 30 min with the indicated concentrations of PMA (A) or ionomycin (D), followed by treatment with 100 nM insulin for 15 min. (B, C, E, and F) Representative Fluo-3 AM images (B) and quantification (C) of intracellular Ca2+ in HepG2 cells treated with PMA. Data represent means ± SEM (n = 5, *P < 0.05).

