Fig. 1.
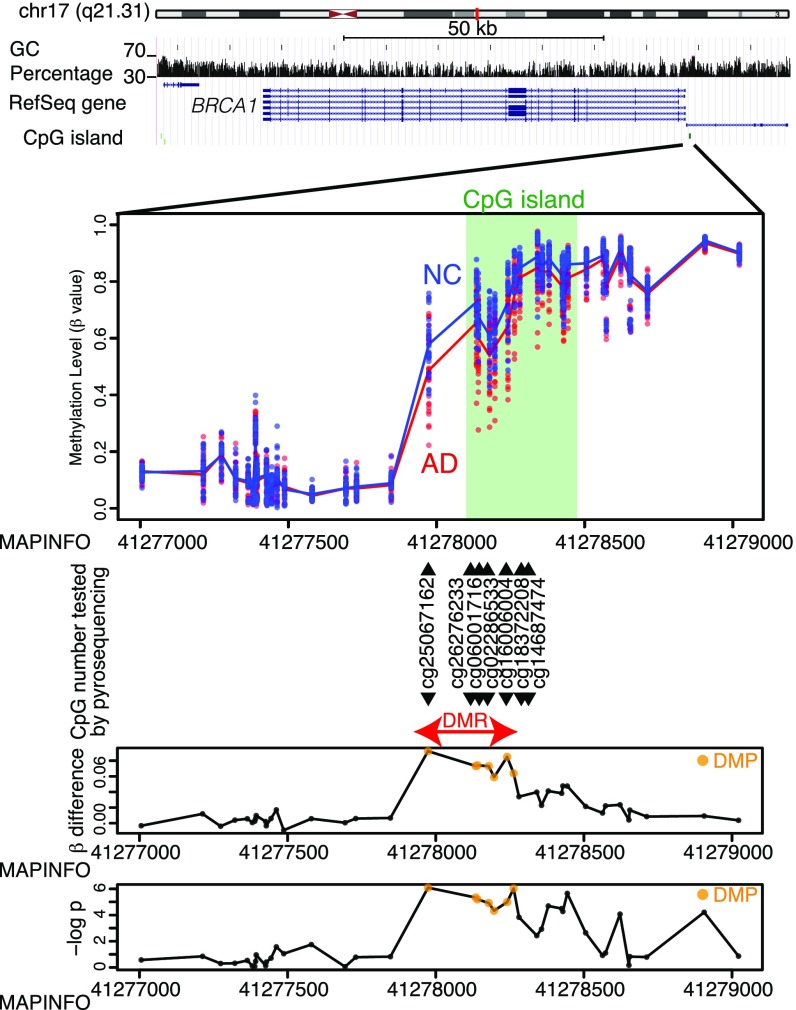
Details of DMR associated with BRCA1. The uppermost panel shows genomic structures from the University of California, Santa Cruz, genome browser including chromosomal ideogram, GC content (vertical bars), RefSeq gene map (blue lines and bars), and CpG islands (green bars). The second panel depicts β values of each sample at each CpG site. Dots are β values from each sample, and solid lines are mean β values of each group. Light green areas correspond to CpG islands. CG identifiers listed are the sites where methylation levels were validated using an additional pyrosequencing assay. The last two panels show β-value differences (Upper, βNC − βAD) and significance levels on a −log(P) scale at each CpG site. Orange dots represent differentially methylated probes (DMPs) discovered by Infinium screening.

