Fig. 3.
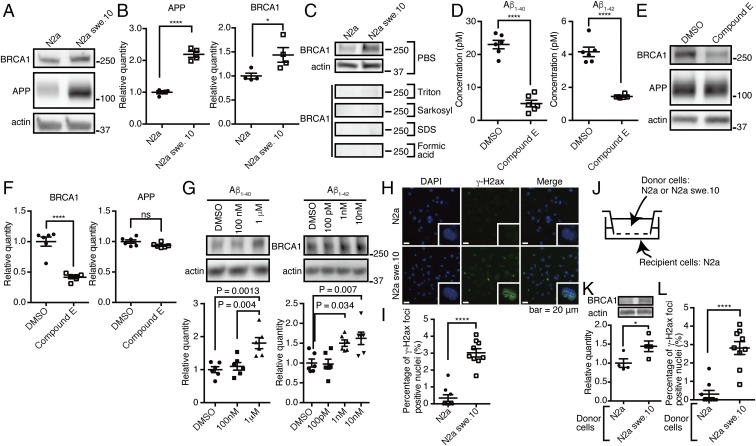
Aβ confers BRCA1 overexpression. (A) Western blot of N2a and swe.10 cells using anti-mouse BRCA1 and anti-APP antibodies. Actin was detected as a loading control. (B) Quantitative measurement of the relative amount of APP and BRCA1 from experiments in A. n = 4. Relative quantity against actin expression level was normalized to N2a = 1.0. Mean ± SEM: APP: 1.00 ± 0.05 in N2a cells vs. 2.19 ± 0.10 in N2a swe.10 cells; BRCA1: 1.00 ± 0.06 in N2a cells vs. 1.44 ± 0.15 in N2a swe.10 cells. (C) Serial fractionation of N2a and swe.10 cells using various detergents. (D) Concentrations of Aβ40 and Aβ42 in the culture media supernatant of N2a swe.10 cells treated with dimethyl sulfoxide (DMSO) or 25 nM compound E were measured by ELISA. n = 6. Mean ± SEM: Aβ40: 23.00 ± 1.28 pM in DMSO vs. 5.08 ± 1.00 pM in compound E; Aβ42: 4.16 ± 0.29 pM in DMSO vs. 1.45 ± 0.04 pM in compound E. (E) Western blot of N2a swe.10 cells treated with DMSO or compound E by anti-mouse BRCA1 and anti-APP antibodies. (F) Quantitative measurement of the relative amount of BRCA1 and APP from E. n = 6. Relative expression level was normalized to DMSO = 1.0. Mean ± SEM: BRCA1: 1.00 ± 0.08 in DMSO vs. 0.41 ± 0.02 in compound E; APP: 1.00 ± 0.03 in DMSO vs. 0.94 ± 0.02 in compound E. (G) Effect of recombinant Aβ40 and Aβ42 on BRCA1 expression. Western blot of N2a cells by anti-mouse BRCA1 and anti-actin antibodies. Quantitative measurement of the relative amount of BRCA1 is shown below (n = 6 independent wells). Each relative expression level of BRCA1 was normalized to DMSO = 1. One-way ANOVA [Aβ40: F(2,15) = 11.63, P = 0.0009; Aβ42: F(3,20) = 7.981, P = 0.0011] with post hoc Turkey method. Mean ± SEM: Aβ40: 1.00 ± 0.09 in DMSO, 1.10 ± 0.11 in 100 nM, 1.80 ± 0.17 in 1 μM; Aβ42: 1.00 ± 0.10 in DMSO, 0.97 ± 0.12 in 100 pM, 1.50 ± 0.08 in 1 nM, 1.62 ± 0.16 in 10 nM. (H) Immunofluorescence images of N2a and swe.10 cells stained with DAPI, and anti–γ-H2ax antibody. Insets show single nuclei at high magnification. (I) Quantitative analysis of the number of cells with nuclear γ-H2ax foci in H. n = 9 visual fields (3 visual fields from 3 experiments). Mean ± SEM: 0.34 ± 0.20% in N2a cells and 3.02 ± 0.25% in N2a swe.10 cells. (J) Diagram of coculture system. Recipient cells were used for biochemical and immunohistochemical analysis. (K) Western blot of recipient N2a cells by anti-mouse BRCA1 and anti-actin antibodies. Quantitative measurement of the relative amount of BRCA1 is shown below (n = 4 independent wells). Each relative expression level was normalized to N2a-donor culture. Mean ± SEM: 1.00 ± 0.11 in N2a cells and 1.44 ± 0.14 in N2a swe.10 cells. (L) Quantitative analysis of the number of cells with nuclear γ-H2ax foci in the recipient N2a cells. n = 9 visual fields (3 visual fields from 3 experiments). Mean ± SEM: 0.31 ± 0.20% in N2a cells and 2.81 ± 0.35% in N2a swe.10 cells. *P < 0.05 and ****P < 0.0001. ns, not significant.

