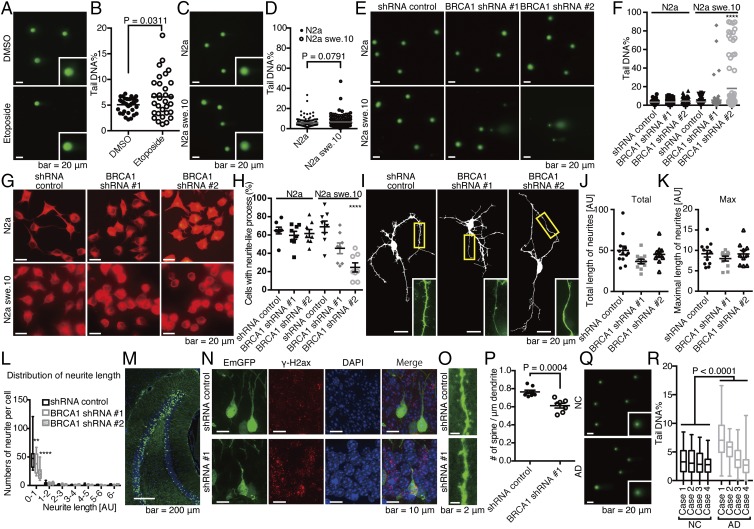
Fig. 4.
Functional relevance of BRCA1 dysfunction in an in vitro and in vivo neuronal model with Aβ burden. (A) Comet assay images of N2a treated with DMSO or 50 μM etoposide for 6 h. (B) Quantification of tail DNA%. Closed circles represent N2a cells treated with DMSO, and open circles, etoposide. n = 39 cells (DMSO) and 31 cells (etoposide). Mean ± SEM: 5.07 ± 0.21% in DMSO and 6.60 ± 0.73% in etoposide. (C) Comet assay images of N2a and N2a swe.10 cells. Representative images are shown. Insets are a high magnification of single nuclei. (D) Quantification of tail DNA%. Closed circles represent N2a cells, and open circles, swe.10. n = 150 cells. Gray bars represent means. Mean ± SEM: 5.72 ± 0.34% in N2a cells and 6.68 ± 0.42% in N2a swe.10 cells. Biological replicates are shown in SI Appendix, Fig. S10A. (E) Representative comet assay images are shown from a total of n = 80 N2a and swe.10 cells after lentiviral transduction of BRCA1 shRNA. (F) Statistical significance of BRCA1 knockdown on DNA fragmentation was determined using the Tukey method. Bars represent means. Mean ± SEM: N2a: 3.45 ± 0.24% in shRNA control, 3.59 ± 0.27% in shRNA #1, 4.40 ± 0.34% in shRNA #2; N2a swe.10: 3.67 ± 0.35% in shRNA control, 5.59 ± 1.37% in shRNA #1, 18.06 ± 3.10% in shRNA #2. Biological replicates are shown in SI Appendix, Fig. S10B. (G) Representative images of the differentiated N2a and swe.10 cells treated with shRNAs are shown (n = 8 visual fields). (H) Quantification of cells with neurite-like process. Statistical significance was calculated by the Tukey method. Mean ± SEM: N2a: 64.86 ± 3.65% in shRNA control, 59.64 ± 4.33% in shRNA #1, 61.62 ± 4.36% in shRNA #2; N2a swe.10: 68.98 ± 6.62% in shRNA control, 45.46 ± 5.81% in shRNA #1, 24.61 ± 4.98% in shRNA #2. (I) Representative images of primary neuronal cultures of cortical tissues from 3×Tg mice. Total length of neurites (J), maximal length of neurites (K), and neurite length distribution (L) were analyzed. Control (n = 12 neurons), shRNA #1 (n = 11 neurons), and shRNA #2 (n = 10 neurons). Statistical significance was determined by the Tukey method. Boxes extend from the 25th to 75th percentiles, and the lines in the boxes represent the median. The whiskers show the minimum and maximum values. (M) Knockdown of BRCA1 in vivo. Lentivirus expressing shRNA against BRCA1 was stereotactically injected into the dentate gyrus (DG) of APP/PS1 mice at 3 mo of age, and mice were killed 3 wk after the surgery. (N) Immunofluorescence images of the neuronal cell in DG stained with DAPI, and anti–γ-H2ax antibody. (O) Spine density of the neuronal cells in DG. n = 8 (control) and 7 (shRNA #1) dendrites. Representative images are shown. (P) Statistical analysis of O. Mean ± SEM: 0.76 ± 0.02/μm in shRNA control and 0.61 ± 0.03/μm in shRNA #1. (Q) Nucleus from inferior temporal gyrus of four NC and four AD brains were subjected to comet assay. Representative images are shown. (R) Statistical analysis of Q. Boxes extend from the 25th to 75th percentiles, and the lines in the boxes represent the median. The whiskers show the minimum and maximum values. n = 70–100 nuclei from each sample. Statistical significance was determined using two-way ANOVA [NC vs. AD: F(1,707) = 100.6, P < 0.0001; sample: F(3,707) = 52.30, P < 0.0001]. Mean ± SEM: NC: 3.54 ± 0.24%, 3.36 ± 0.23%, 3.13 ± 0.21%, and 2.58 ± 0.15%; AD: 7.45 ± 0.34%, 5.46 ± 0.19%, 3.64 ± 0.22%, and 2.80 ± 0.24%. **P < 0.01 and ****P < 0.0001.

