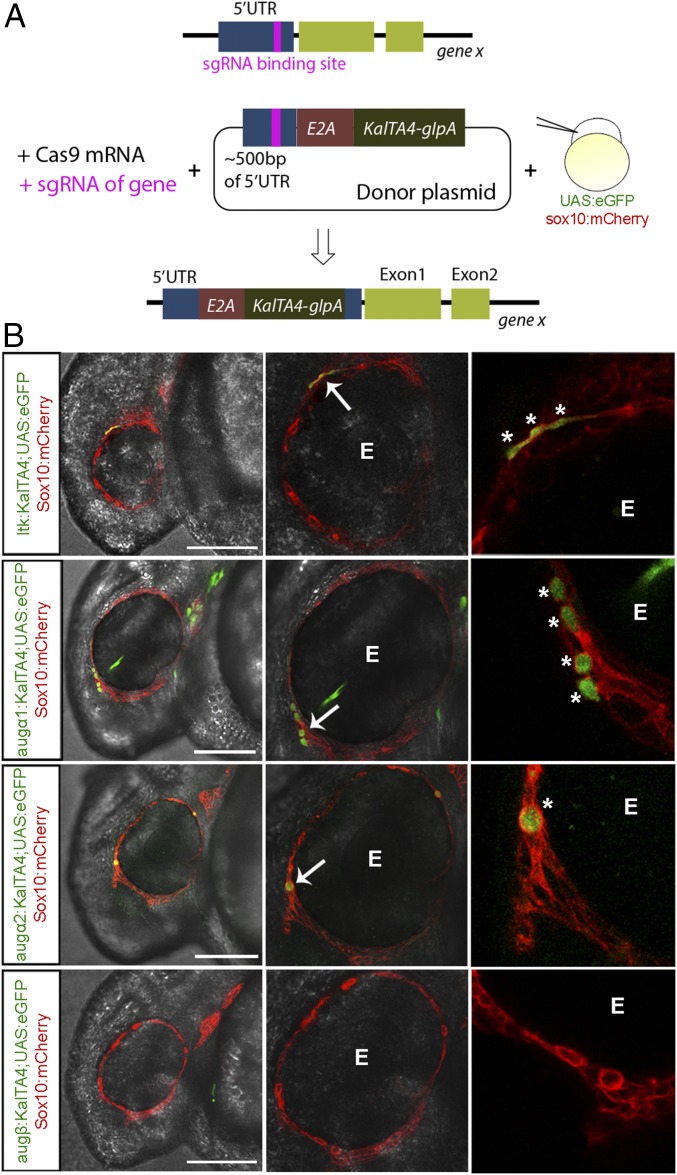
Fig. 3.
Ltk, Aug-α1, and Aug-α2 are expressed in NCCs during iridophore development. (A) Schematic representing the experimental strategy used to generate ltk and augmentor KalTA4 fish. (B) Lateral view of a confocal cross-section of 24-hpf zebrafish embryos injected as in A (the head region is to the left). UAS expression is driven by the KalTA4 ORF in the 5′ UTR region of each gene, thus activating UAS:eGFP+ cells. mCherry expression is driven by the sox10 promotor to indicate Sox10+ NCCs. eGFP and mCherry colocalization indicate ltk, aug-α1, and aug-α2 expression (green) in Sox10+ NCCs (red) within the peripheral area of the eye (E). White arrows indicate cells coexpressing eGFP and mCherry. Asterisks indicate single NCCs expressing eGFP. (Scale bars: 120 μm.)

