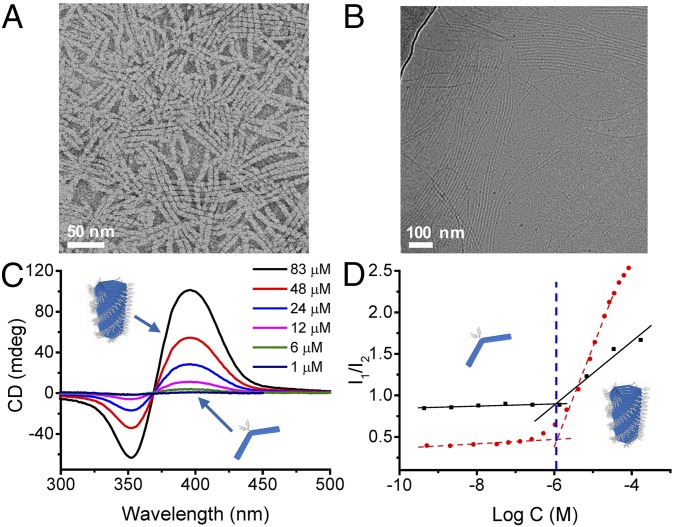
Fig. 2.
Synthetic tubules spontaneously form in water. (A) TEM micrograph of the tubules formed by building block 1 at c = 83 μM. (B) Cryo-TEM micrograph of the tubules formed by building block 2 (1.3 mM). The main cryo-TEM contrast is provided by the core of the tubules constituted by the aromatic units. (C) CD spectra at incrementally increased concentrations of 1 between 1 µM (absence of the CD signal) to 83 µM (the highest CD intensity). (D) Determination of the critical aggregation concentration for building blocks 1 and 2 using the fluorescent probe Nile red (0.94 µM). The ordinate shows the ratio of intensities of the fluorescence bands (612 and 650 nm for 1; 621 and 647 nm for 2) (red dots, 1 and black square, 2). Nile red present in the hydrophobic environment of the tubules shows increased fluorescence intensity and an emission maximum at λmax ∼ 620 nm compared with λmax ∼ 650 nm in water (SI Appendix, Fig. S11).

