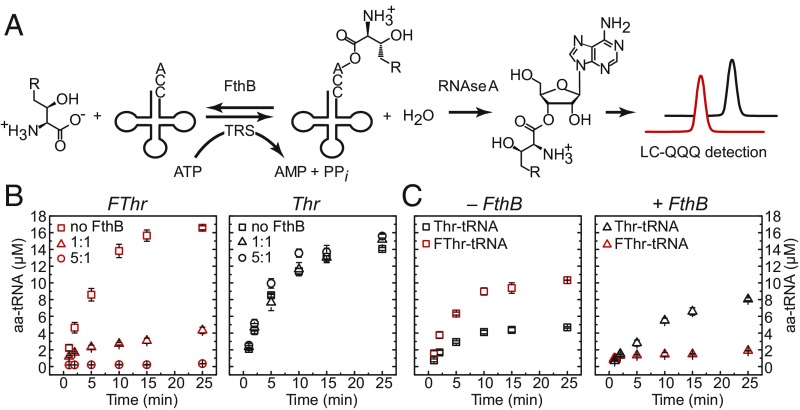
Fig. 2.
Aminoacylation levels of tRNAThr with threonine (R = H) or fluorothreonine (R = F) as a function of FthB. (A) The amino acid was charged by 50 nM S. cattleya ThrRS and monitored by LC-MS/MS following enzymatic digestion with RNase A. In vitro transcribed tRNAThr was present at 24 μM in all reactions. (B) Aminoacylation of fluorothreonine (5 mM) and threonine (5 mM) in the presence of 0, 50, or 250 nM FthB. (C) Competitive assay containing equimolar fluorothreonine (5 mM) and threonine (5 mM) in the presence of 0 or 50 nM FthB. Each data point represents the mean ± SE (n ≥ 3).

