Fig. 2.
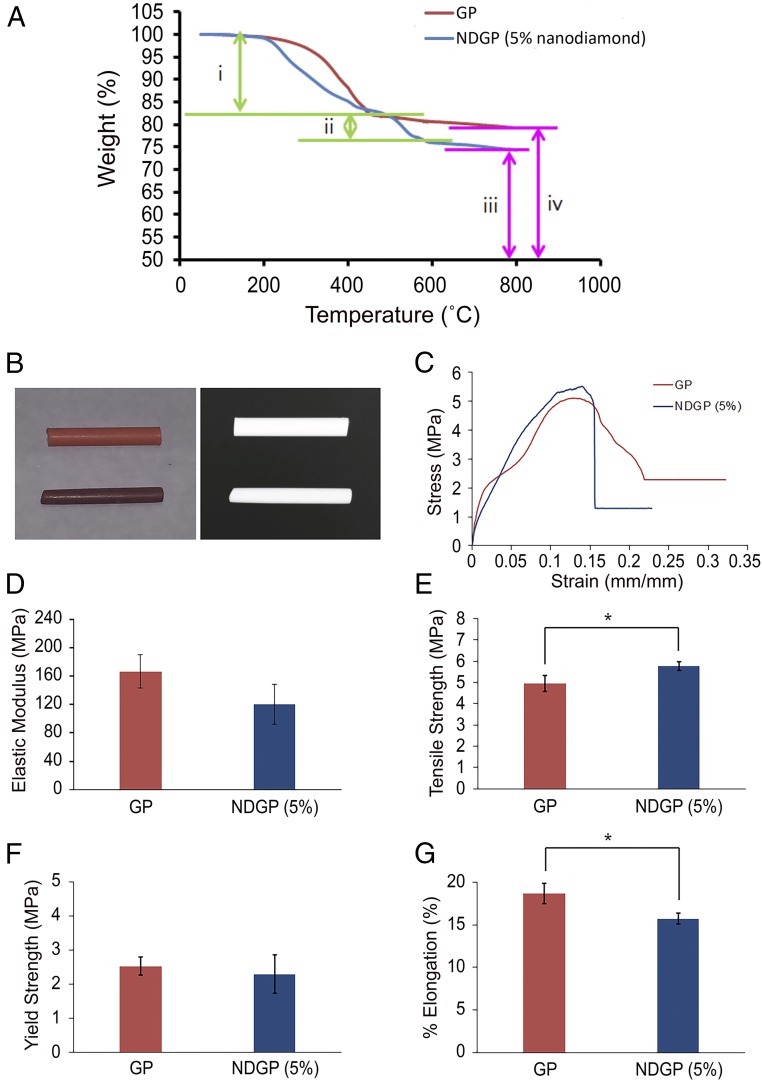
Thermogravimetric analysis and mechanical properties comparisons between the unmodified GP product and the 5% NDGP. (A) Thermodiagram of the GP and NDGP. (A, i) Decrease in wt% of GP and NDGP is attributed to the polymer decomposition and organic moiety. (A, ii) The amount of decomposed ND is equal to the amount of ND incorporated into the NDGP. (A, iii and iv) BaSO4 and ZnO residues left after the thermal decompositions. (B, Left) Image of GP (top) and NDGP (bottom) pellets. (B, Right) Digital X-ray image of GP (top) and NDGP (bottom) pellets. (C) Stress–strain curves from the measurement of tensile strength of GP and NDGP (5 wt% ND). (D) Elastic moduli of GP (167 ± 23.6 MPa) and NDGP with 5 wt% of ND (120 ± 28.3 MPa). Elastic moduli were calculated from the elastic region, the initial linear part of the stress–strain curves. Data are described as mean ± SD (n = 3), P value = 0.15. (E) Tensile strengths, the highest stress point of the stress–strain curve, for GP (4.9 ± 0.38 MPa) and NDGP with 5 wt% of ND (5.8 ± 0.20 MPa). Data are described as mean ± SD; *P value = 0.049 (n = 3). (F) The 0.2% offset yield strength of GP (2.5 ± 0.27 MPa) and NDGP with 5 wt% of ND (2.3 ± 0.57 MPa) measured from stress testing were correlated to the intersections of a stress–strain curve and projected straight lines, which were parallel to the initial straight portion of the stress–strain curve. The correlations explain the elastic limits of GP and NDGP. Data are described as mean ± SD (n = 3), P value = 0.63. (G) Percentages of elongation of GP (18.6 ± 1.18%) and NDGP with 5 wt% of ND (15.7 ± 0.660%) were calculated from comparing the change in length with the length of the original material. Data are described as mean ± SD; *P value = 0.04 (n = 3).

