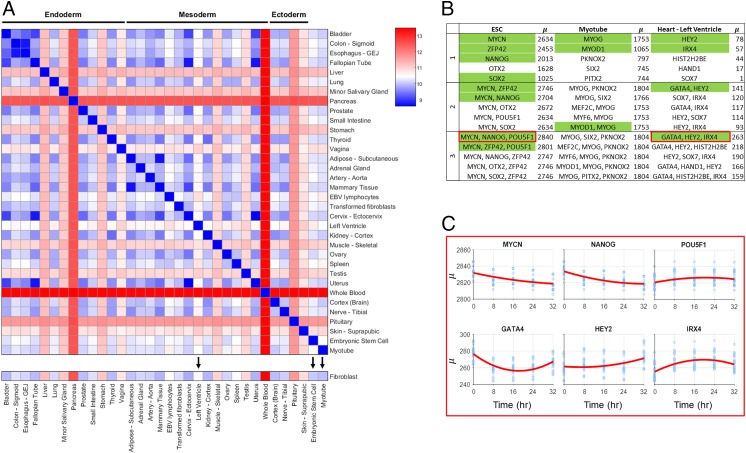
Fig. 3.
Quantitative measure between cell types and TF scores. (A) values between GTEx tissue types and ESC, myotube, and fibroblast. Tissue types and cell types with black arrows have predicted TFs for reprogramming from fibroblasts shown in B. (B) Table of predicted TFs for a subset of cell and tissue types. Top five TFs for combinations of one to three are shown. Green labeled TFs are highly associated with the differentiation process of the target cell type and/or validated for reprogramming. These TFs are discussed in the main text. (C) Time-dependent scores for selected combinations of three TFs for fibroblast to ESC and fibroblast to “heart - left ventricle.” x axis refers to time of TF addition, and y axis refers to .

