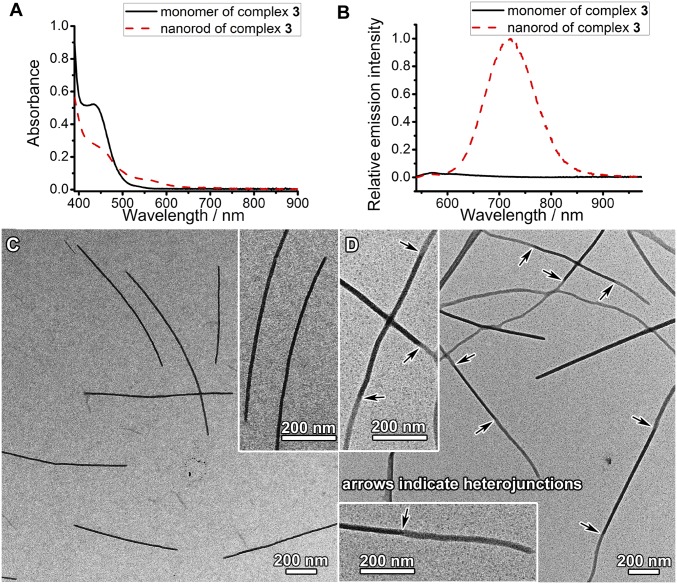
Fig. 6.
(A) UV-Vis absorption spectra and (B) steady-state emission spectra (λex = 482 nm) of complex 3 (0.13 mM) in DMF and the nanorods formed by complex 3 (0.13 mM) in a mixed solvent of DMF–water (1:9, vol/vol). (C) TEM image of nanorods formed by complex 3 in a mixed solvent of DMF–water (1:9, vol/vol). (D) TEM image of segmented nanostructures formed after adding complex 1 and PEG45-b-PAA69 to the as-formed nanorods of complex 3 in C at a final complex 1/complex 3/carboxylic acid molar ratio of 0.15/0.13/1. The arrows in D indicate heterojunctions.

