Fig. 6.
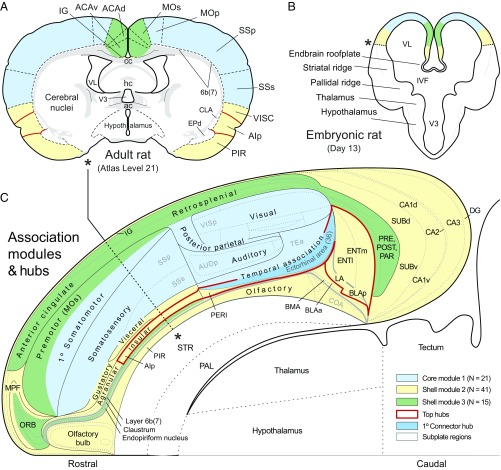
Mapping the spatial distribution of modules and hubs in the rat. A shows the general localization of cortical regions and the cortical plate parts of M1–M3 (color coded) on a transverse section from the standard brain atlas used to create connection reports for this analysis. B is a fate map of presumed module localization on a transverse section of the forebrain vesicle on embryonic day 13. C shows the spatial extent of M1–3, the top-ranked hubs, including the primary connector hub, on a regionalized flat map of the right cerebral cortex. Note the basic core and shell arrangement of modules, with M1 (blue) forming a lateral core, and M2 (yellow) and M3 (green) forming (respectively) ventral and dorsal segments of the shell. The cortical subplate forms a deep layer 6b (or 7) of the cerebral cortex and as such is nested (gray outline) in the overall cortical plate representation (28). The topographic distributions in A and B serve primarily to help understand the flat-map topology (see the asterisk and dashed line in C, and the corresponding asterisks in A and B). For high-resolution details of the flat map, see ref. 28. Abbreviations are defined in Datasets S1 and S3 (worksheet 2). A and C are adapted from ref. 28, and B is adapted from ref. 29.

