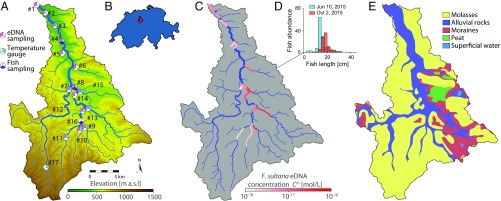
Fig. 1.
Overview of the study area and data. (A) Digital terrain model of the Wigger and extracted river network with location of the sampling sites. Site numbers are introduced by the number sign (#). (B) Position of the Wigger catchment in Switzerland. (C) Mean measured F. sultana eDNA concentration. Ungauged stretches are depicted in blue. (D) Results of fish sampling campaign on site 8 in 2015. The reader is referred to SI Appendix, Fig. S1 for the complete dataset. (E) Geological characterization of the catchment.

