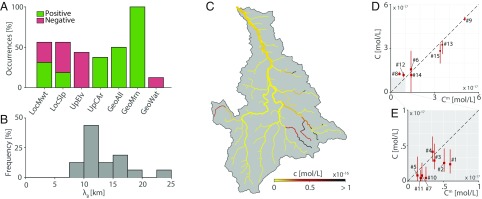
Fig. 2.
Results from the bryozoan habitat suitability study. (A) Occurrence of covariates in behavioral models. “Positive” and “negative” refer to the signs of the calibrated coefficients. Covariates’ abbreviations are as in SI Appendix, Table S4. GeoAll, percentage of alluvial rocks; GeoMrn, percentage of moraines; GeoWat, percentage of superficial water; LocMwt, local mean water temperature; LocSlp, local slope; UpCAr, contributing area; UpElv, upstream mean elevation. (B) Distribution of calibrated values of in behavioral models. (C) Map of local eDNA concentration obtained by averaging results from all behavioral models. (D) Modeled () vs. observed () F. sultana eDNA concentration. Red lines identify 10th–90th percentile ranges of the distribution of all accepted models; squares represent values averaged over all accepted models. Site numbers are introduced by the number sign (#). (E) Zoomed in view of D.

