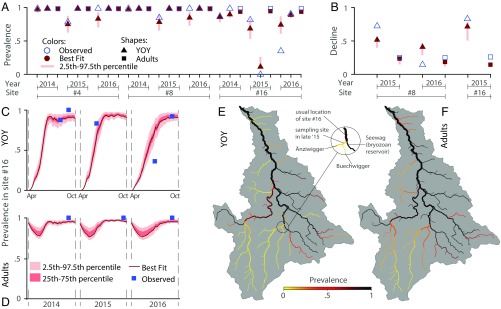
Fig. 3.
Results from the epidemiological metacommunity model. Results of calibration against (A) prevalence data and (B) seasonal fish decline measured as the fractional decline of the estimated population size in late summer compared with early summer. In A, the left point of each year group corresponds to YOY early summer sampling. The observed zero-prevalence value was actually measured in a stretch upstream of site 16 (E and in the text). Site numbers are introduced by the number sign (#). Time evolution of modeled prevalence in site 16 for (C) YOY and (D) adult fish. The intraseasonal model is run for 200 d starting on April 1. Note that the YOY prevalence sample in October of 2015 is missing. Maps of best fit-modeled PKD prevalence evaluated at the end of the summer of 2016 for (E) YOY and (F) adults. E features a zoomed in view of site 16.

