Fig. S1.
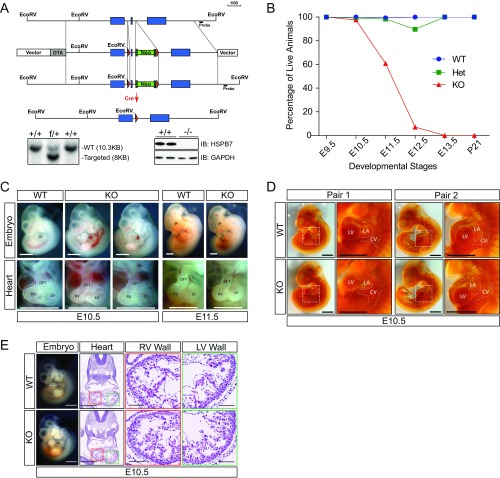
General phenotype of HSPB7 KO mice. (A) Targeting strategy for the generation of HSPB7 KO mice. (Lower Left) Detection of WT (+) and f alleles by Southern blot analysis indicates correctly targeted ES cells. (Lower Right) Western blot analysis confirms complete depletion of HSPB7 in KO (−/−) animals. GAPDH served as a loading control. Blue box, HSPB7 exon; DTA, diphtheria toxin A chain gene; green box abutted to the to the Neo gene, FLP site; Neo, neomycin resistance gene; red triangle, LoxP site. IB, immunoblot. (B) Percentage of live WT, HSPB7 heterozygous KO (Het), and HSPB7 homozygous global KO embryos/mice at various developmental stages. The actual embryo/pup numbers of each genotype are presented in Table S1. (C) Whole-mount microscopic images of whole embryos (left lateral view) and embryonic hearts (anterior view) of WT and HSPB7 KO embryos from E10.5 to E11.5. LV, left ventricle; OFT, outflow tract; RV, right ventricle. (Scale bar: 1 mm.) (D) Microscopic left lateral views of two (pairs 1 and 2) PECAM-stained E10.5 WT and HSPB7 KO embryos. High magnification views correspond to the dotted box in the whole-embryo images. CV, cardinal vein; LA, left atria; LV, left ventricle. (Scale bar: 1 mm.) (E) H&E images of E10.5 WT and HSPB7 KO embryos acquired using NanoZoomer slide scanner. (Scale bar: 0.5 mm.) Estimated location of sectioning is indicated by a dotted line on the whole-mount embryo images to the left. (Scale bar: 1 mm.) Magnified right ventricle (RV; red box) and left ventricle (LV; green box) wall views are shown to the right. (Scale bars: 0.1 mm.)

