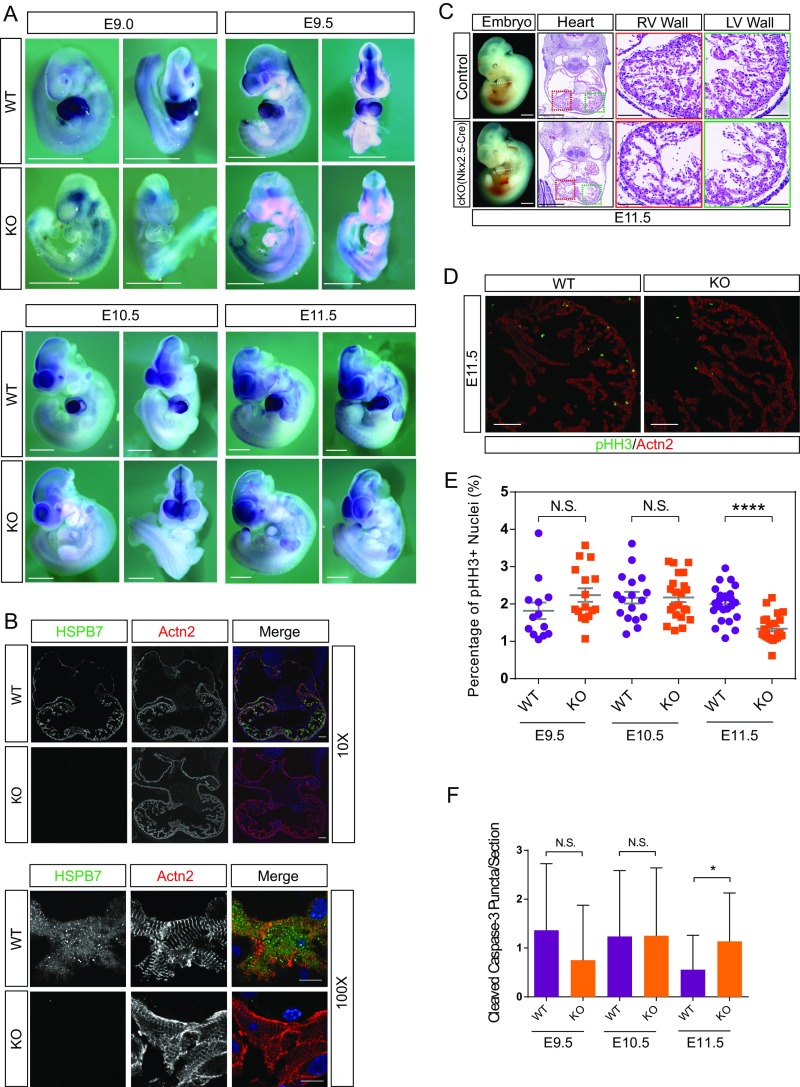
Fig. S2.
Expression pattern of HSPB7 in mouse embryos and general phenotype of HSPB7 cardiac-specific KO by Nkx2.5-Cre. (A) Whole-mount RNA in situ hybridization (ISH) analysis of HSPB7 expression in whole WT and HSPB7 KO embryos (left lateral and anterior views) at E9.0–E11.5 using an HSPB7-specific probe. The unspecific signal in the head/pharyngeal arches region of both WT and KO embryos is caused by ISH probes that were trapped in the cavities. (Scale bar: 1 mm.) (B) Immunofluorescence analysis of HSPB7 (green) and α-actinin (Actn2; red) in a traverse section of the heart of E11.5 WT and HSPB7 KO embryos. Colors are depicted in merged images. DNA was stained with DAPI. (Scale bar: 10× objective, 100 μm; 100× objective, 10 μm.) (C) H&E images of E11.5 control and HSPB7 cardiac-specific KO (cKO) using Nkx2.5-Cre embryos acquired using NanoZoomer slide scanner. (Scale bar: 0.5 mm.) Estimated location of sectioning is indicated by a dotted line on the whole-mount embryos images to the left. (Scale bar: 1 mm.) Magnified right ventricle (RV; red box) and left ventricle (LV; green box) wall views are shown to the right. Left and right ventricle wall thicknesses are indicated by rulers. (Scale bar: 0.1 mm.) (D) Representative immunofluorescence images of pHH3 (green) and Actn2 (red) in a transverse section of the heart of E11.5 WT and HSPB7 KO embryos. (Scale bar: 100 μm.) (E) Percentage of pHH3-positive cardiomyocytes in WT and HSPB7 KO embryos at various developmental stages. E9.5: four to seven sections per embryo, two to three embryos per group. E10.5: four to five sections per embryo, four to five embryos per group. E11.5: five to eight sections per embryo, four embryos per group. Error bars indicate mean ± SEM. Statistical significance was determined with two-tailed Student’s t test. Not significant (N.S.): E9.5, P = 0.1471; E10.5, P = 0.966. ****P < 0.0001. (F) Cleaved Caspase-3 puncta observed in WT and HSPB7 KO cardiomyocytes (highlighted by Actn2 staining) from E9.5 to E11.5. Two to three embryos, 11–34 sections per group. Error bars indicate mean ± SEM. Statistical significance was determined with two-tailed Student’s t test. *P = 0.0433.

