Fig. S4.
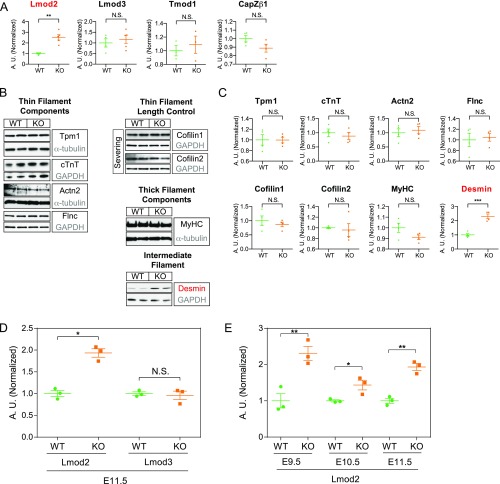
Lmod2 transcript is up-regulated in HSPB7 KO embryos. (A) Quantitative densitometric analysis of Lmod2, Lmod3, Tmod1, and CapZβ1 in E11.5 hearts isolated from WT and HSPB7 KO. Proteins depicted in red were found to be significantly increased in HSPB7 KO embryos. Three to five embryos per group. Error bars indicate mean ± SEM. Statistical significance was determined with two-tailed Student’s t test. **P = 0.0012 (Lmod2). (B) Western blot and (C) corresponding quantitative densitometric analysis of various actin binding proteins in E11.5 hearts isolated from WT and HSPB7 KO. GAPDH or α-tubulin served as loading controls (gray). Flnc and cofilin1 share the same GAPDH loading control, as they were cut from the same membrane. Proteins depicted in red were found to be significantly increased in HSPB7 KO embryos. Four to five embryos per group. Error bars indicate mean ± SEM. Statistical significance was determined with two-tailed Student’s t test. ***P = 0.0005 (desmin). (D) qRT-PCR analysis of Lmod2 and Lmod3 in E11.5 WT and HSPB7 KO hearts. Data are normalized to corresponding 18S levels and expressed as arbitrary units (A.U.); n = 3 embryos per group with each reaction tested in triplicate. Data are represented as mean ± SEM. Statistical significance was determined with two-tailed Student’s t test. N.S. (P = 0.7251). *P = 0.0014. (E) qRT-PCR analysis of Lmod2 at different developmental stages (E9.5–E11.5) in WT and HSPB7 KO hearts. Data are normalized to corresponding 18S levels and expressed as A.U.; n = 3 embryos per group with each reaction tested in triplicate. Data are represented as mean ± SEM. Statistical significance was determined with two-tailed Student’s t test. N.S., not significant. *P = 0.0331 (E10.5); **P < 0.01 (E9.5, P = 0.0088; E11.5, P = 0.0014).

