Fig. 5.
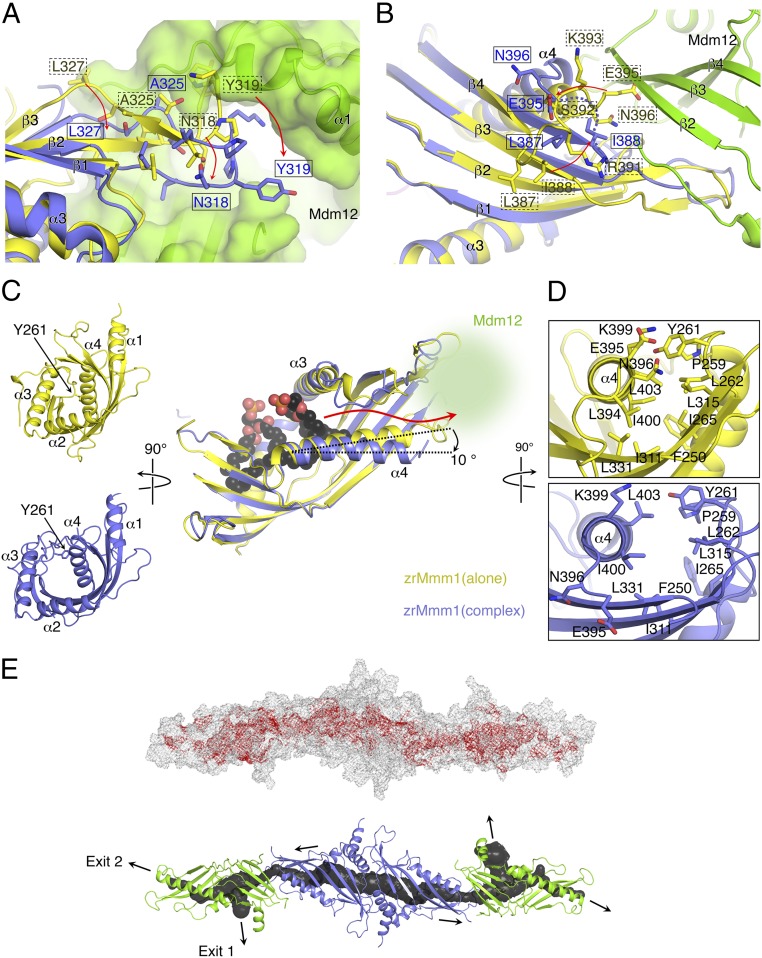
Direct association of zrMmm1 and scMdm12Δ generates a hydrophobic tunnel for phospholipid trafficking. (A) Ribbon diagram showing superposition of zrMmm1 (yellow) and the scMdm12Δ (green)–zrMmm1 (blue) complex. To analyze structural changes in zrMmm1 upon association with scMdm12Δ, the structure of zrMmm1 was aligned with the zrMmm1 structure in the scMdm12Δ–zrMmm1 complex. The scMdm12Δ is shown in surface representation. The G-loop of zrMmm1 undergoes conformational changes following interaction with scMdm12Δ, forming an extended structure that covers the solvent-exposed region of scMdm12Δ. Residues of zrMmm1 undergoing this structural reorganization are shown, and their directions are indicated with red arrows. (B) Structural changes in zrMmm1 occurring upon association with scMdm12Δ further highlighted (more information is provided in the main text) in a diagram colored the same as in A. The dotted line indicates zrMmm1 residues that become disordered upon forming the complex. (C, Right) Direct association of zrMmm1 and scMdm12Δ moves the α4 helix of zrMmm1 by ∼10° outward, vacating enough space to accommodate and transfer phospholipids. Phospholipids bound to zrMmm1 are shown in surface-filling representation. The red arrow indicates the putative pathway of phospholipids from zrMmm1 to scMdm12Δ. (C, Left) Ribbon diagrams compare the overall structure of zrMmm1 in the apo (yellow) and complexed (blue) forms viewed from the left side of the figure (C, Right). Loops, including Tyr261, in the complexed form are shifted outward, generating an open space in the process. The scMdm12Δ is omitted for clarity. The overall color scheme is the same as in A. (D) Structures of zrMmm1 in the apo (yellow) and complexed (blue) forms viewed from the right side of the picture (C, Right). (E) Overall structure of the scMdm12Δ–zrMmm1 complex shown in meshed line (Top) and ribbon (Bottom) representations. (Top) Red mesh representing hydrophobic amino acids inside the tunnel was superimposed on the figure. (Bottom) Channel (cavity) through the scMdm12Δ–zrMmm1 complex was analyzed by Mole 2.0 (43), and is shown in black tubule representation. Black arrows indicate the putative pathway for phospholipid trafficking.

