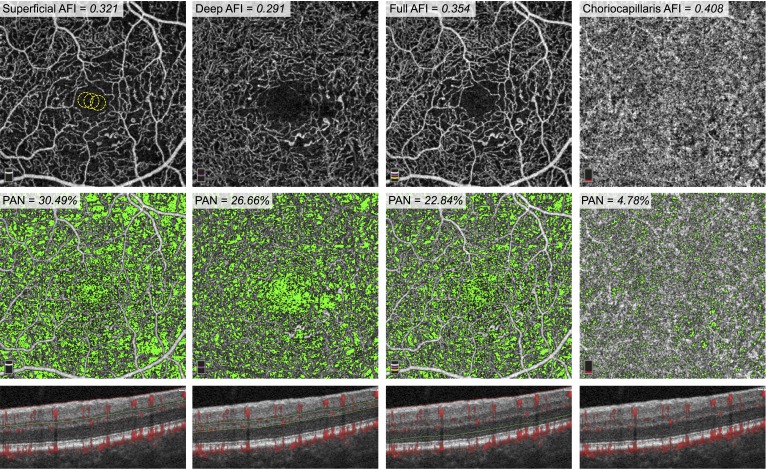
Figure 2.
AFI and PAN Measurements in an eye with NPDR. Top Row: En face OCTA of the SCP (left), DCP (middle-left), full retinal thickness (middle-right), and choriocapillaris (right). The FAZ of the SCP shows three yellow circles (30-pixel radii), which were the areas used to calculate the noise threshold for this eye. The AFI, or average decorrelation value above this threshold, is reported for each layer. Middle Row: Areas of nonperfusion, defined as pixels with values below the noise threshold, are shown here in green and reported as PAN. Bottom Row: Cross-sectional OCT with red flow overlay representing decorrelation. Green and red segmentation boundaries are shown for each capillary layer.

