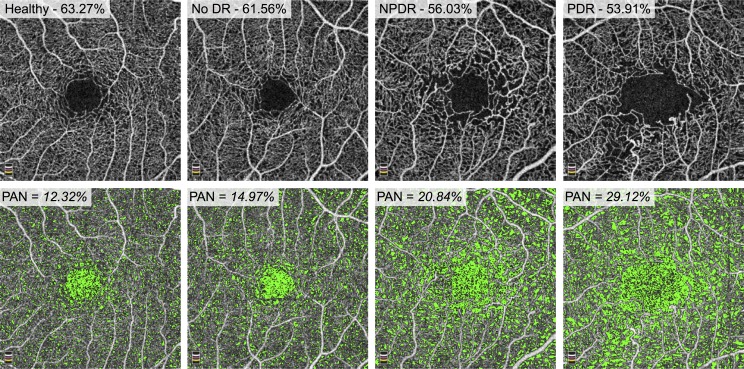
Figure 3.
Vessel density decreases and PAN increases with increasing disease severity. Top Row: En face OCTA of full retinal thickness angiograms for a healthy patient (left), a patient with diabetes without DR (middle left), a patient with NPDR (middle right), and PDR (right). The parafoveal vessel density is reported as a percentage and decreases from left to right. Bottom Row: Areas of nonperfusion are shown in green. PAN is reported as a percentage of the area of nonperfusion to the total retinal area and increases from left to right.

