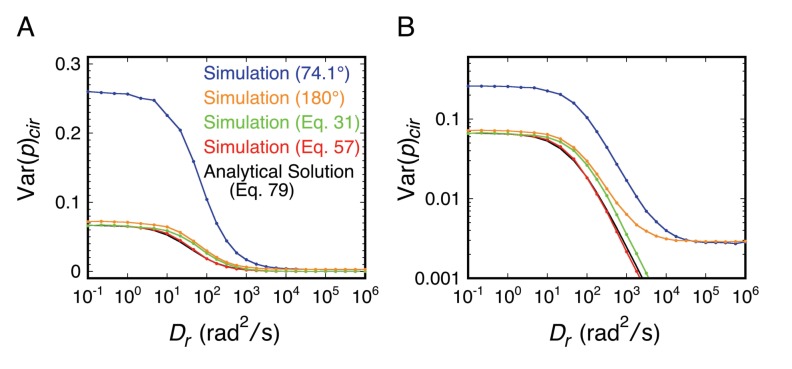
Appendix 2—figure 3. Comparison of the relationship between <p2>cir (=Var(p)cir) and Dr as determined analytically and from rotational random walk simulations for an isotropically rotating spherical particle.
Results are plotted on both linear (A) and log (B) ordinate scales. The red curve reproduces the black curve, providing confirmation of the simulation algorithm. As noted earlier, Equation 57 requires isotropic excitation and B = 1. The relatively small difference between the red and green curves indicates that the error introduced by reducing Equation 31 to Equation 57 is not very high. The blue and orange curves reach a minimum of ~0.003 at high Drt values due to the limited photons recovered from the random walk simulations (shot-noise limited). (black) Equation 79; (red) simulation algorithm using Equation 57 to calculate p; (green) simulation algorithm using Equation 31 to calculate p; (orange) rotational random walk simulation (no noise, no threshold) for a perfect objective (θobj = 180°); (blue) simulation data from Figure 2—figure supplement 1C (θobj = 74.1°). t = 10 ms; Ns = 1400; N = 10,000.

