. 2017 Sep 26;6:e28716. doi: 10.7554/eLife.28716

Figure 6. Analysis of rotational mobility within mixed populations.

(A) Scatterplot of the numbers of photons collected in the p- and s-polarization channels for Pom121-mEos3 (data from Figure 3D; N = 3463). Each dot corresponds to one molecule. (B and C) Simulated photon scatterplots under the indicated conditions, assuming the NAeff = 1.02 in water (θobj = 50°; see Appendix 1—figure 4). The results in (B) were simulated with the value of Dr corresponding approximately to the Var(p)cir in (A), whereas (C) corresponds to a higher rotational mobility at the high end of Regime III. The scatter is significantly wider in (A) than either (B) or (C), suggesting a mixed population. (D) Simulated photon scatterplot for a mixed population consisting of 80% of molecules with Dr,1 = 3160 rad2/s and 20% with Dr,2 = 100 rad2/s. Despite a relatively flat Var(p)cir curve in Regime III, the scatterplots become narrower as Dr increases from 103 to 106 rad2/s (Figure 6—figure supplement 3). The prevalent rotational mobility in the population was chosen guided by the width of the central scatter in (A) compared with the scatterplots in Figure 6—figure supplement 3. (E) Total photon intensity histograms of the experimental results in (A) and the mixed population simulation in (D), fit to a log-normal distribution. (F) Polarization histogram from the results in (D) (compare with Figure 3D). These results support the hypothesis that the p-PALM data for Pom121-mEos3 arise from a mixed population. For appropriate visual comparison with the experimental dataset in (A), N ≈ 3500 for all simulations. The red box near the origin identifies the region eliminated by the 100 photon threshold. Figure 6—figure supplements 18 show additional experimental and simulated photon scatterplots, and the effect of γ under highly anisotropic conditions on polarization histograms.

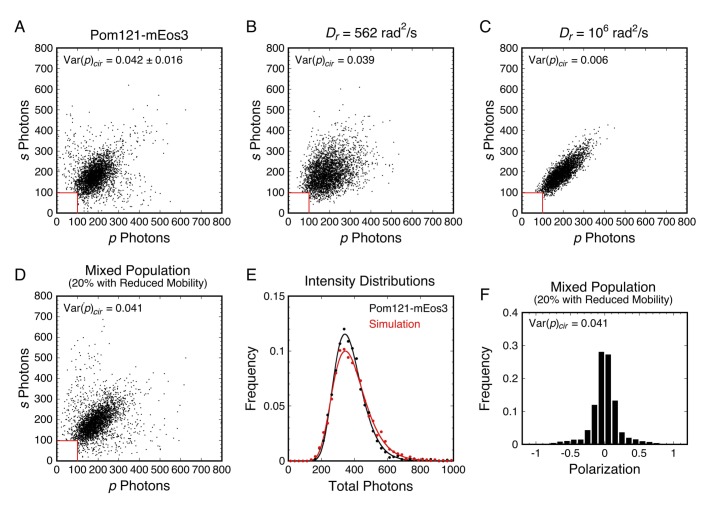
Figure 6.

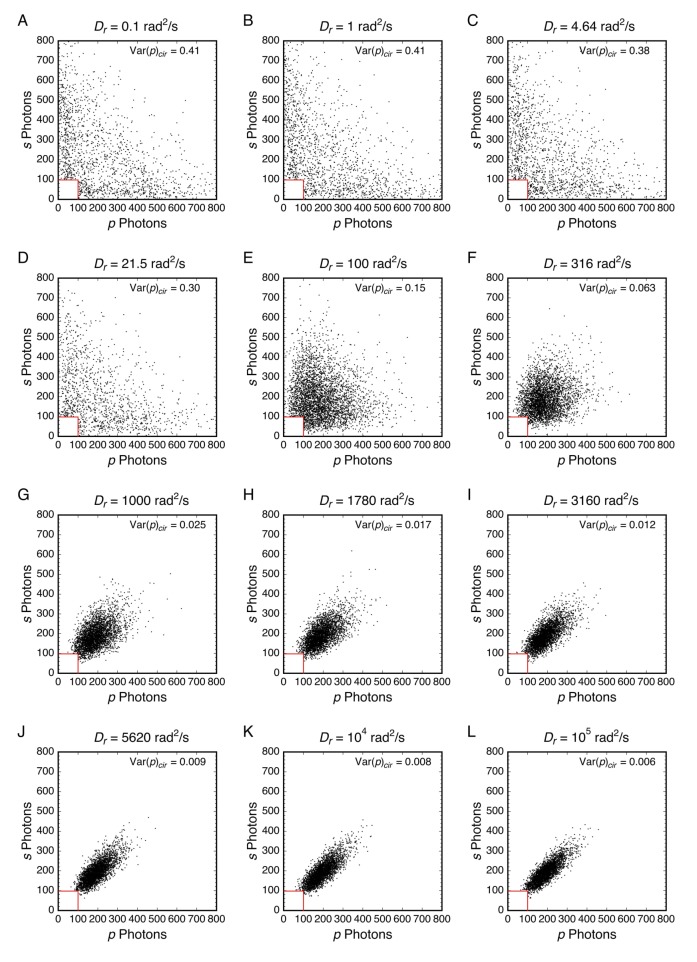
Figure 6—figure supplement 1. Simulated photon scatterplots using circular excitation.

Figure 6—figure supplement 1.

Over a range in Var(p)cir values that are difficult to distinguish experimentally (~103–105 rad2/s), the widths of photon scatterplot distributions clearly narrow as Dr increases (see also Figure 6B and C). As the width of the scatter for Dr = 3160 rad2/s (I) reasonable approximates the central part of the distribution in Figure 6A, this rotational diffusion constant was assumed to be the dominant rotational mobility for the mixed population in Figure 6D. Data from Appendix 1—figure 4 for θeff ≈ 50° (NAeff = 1.02).
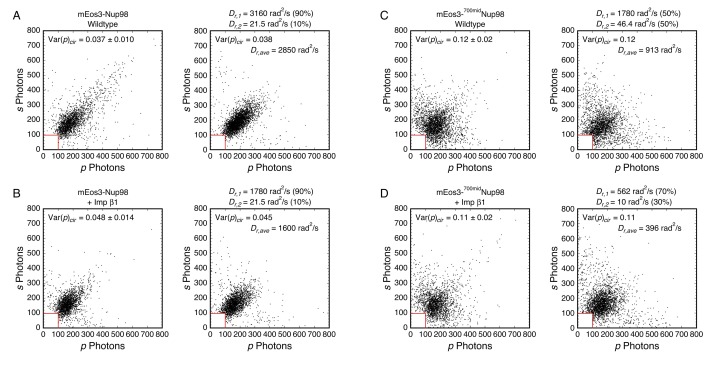
Figure 6—figure supplement 2. Mixed rotational mobility populations for mEos3-Nup98 and mEos3-700midNup98.

Figure 6—figure supplement 2.

Experimental (left) and simulated (right) photon scatterplots were generated under the indicated conditions. (A) Wild-type mEos3-Nup98 (N = 2242) and simulated scatterplot (N = 2455; 2846 steps → Nphotons ≈ 400). (B) mEos3-Nup98 + 10 µM Imp β1 (N = 2180) and simulated scatterplot (N = 2416; 2439 steps → Nphotons ≈ 350). (C) Wild-type mEos3-700midNup98 (N = 2411) and simulated scatterplot (N = 2396; 2439 steps → Nphotons ≈ 350). (D) mEos3-700midNup98 + 10 µM Imp β1 (N = 2840) and simulated scatterplot (N = 2800; 2439 steps → Nphotons ≈ 350). For all simulations, θobj = 50° (NAeff = 1.02; see Appendix 1—figure 4). The average weighted rotational diffusion constant was defined as Dr,ave = f1Dr,1 + f2Dr,2, where f1 and f2 are the fractional sub-populations.
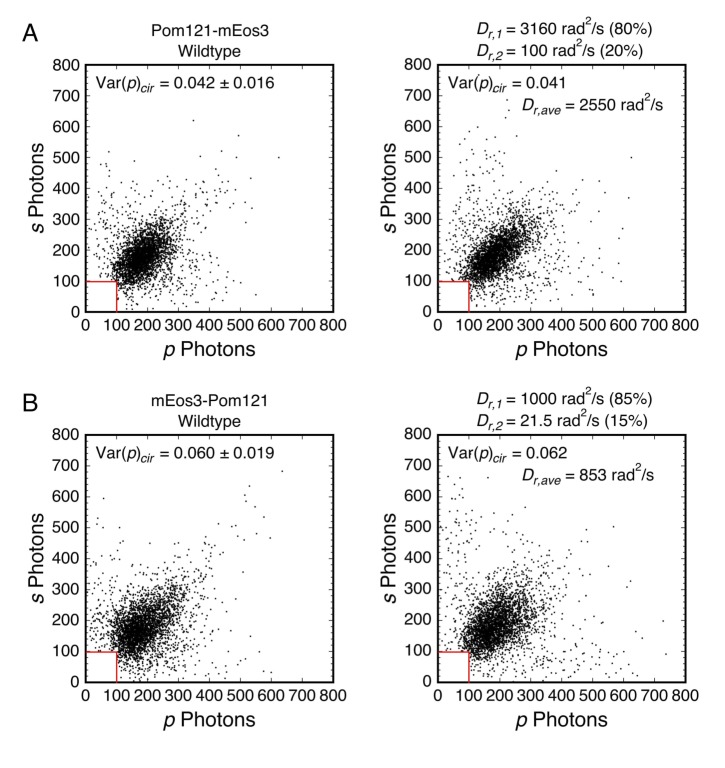
Figure 6—figure supplement 3. Mixed rotational mobility populations for mEos3-tagged Pom121.

Figure 6—figure supplement 3.

Experimental (left) and simulated (right) photon scatterplots were generated under the indicated conditions. (A) Wild-type Pom121-mEos3 (N = 3464) and simulated scatterplot (N = 3461). (B) Wild-type mEos3-Pom121 (N = 3561) and simulated scatterplot (N = 2913). For easier comparison between the two fusion proteins, the plots in (A) are from Figure 6A and D. For all simulations, θobj = 50° (NAeff = 1.02; see Appendix 1—figure 4). See Figure 6—figure supplement 2 for the definition of Dr,ave.
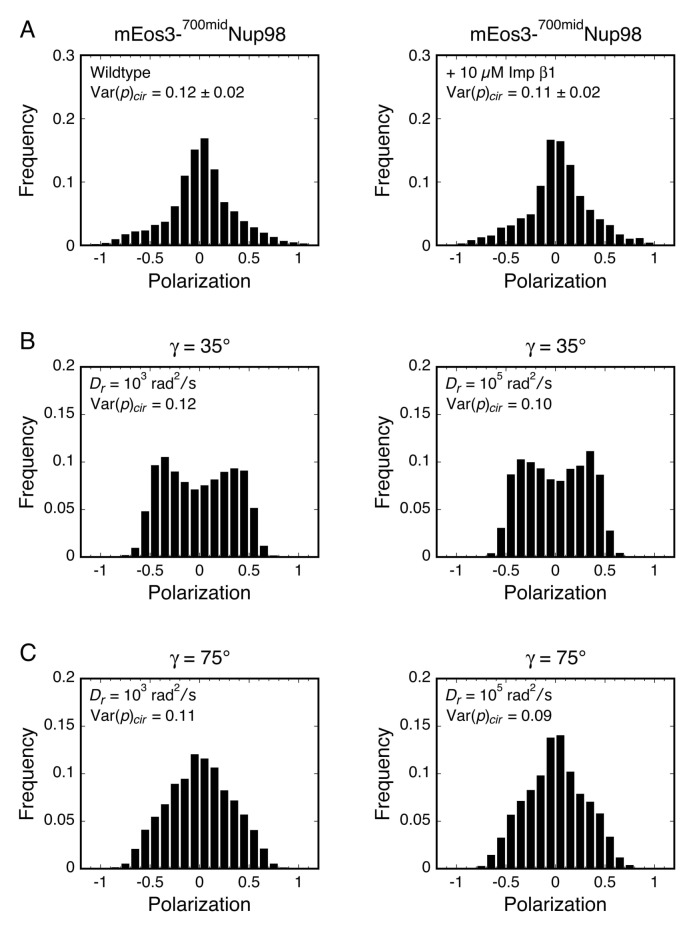
Figure 6—figure supplement 4. Polarization histograms for γ far from the magic angle for Dz/Dxy = 105.

Figure 6—figure supplement 4.

(A) Polarization histograms for mEos3-700midNup98 under wt and +Imp β1 conditions (see Figure 5B). (B and C) Simulated polarization histograms for γ = 35° and 75° for Dz/Dxy = 105 at low and high Dr values (see Appendix 1—figure 2). Despite the similar Var(p)cir values for the histograms in (B) and (C) to those in (A), the shapes are significantly different, indicating that the γ and Dz/Dxy constraints are inconsistent with the experimental results.
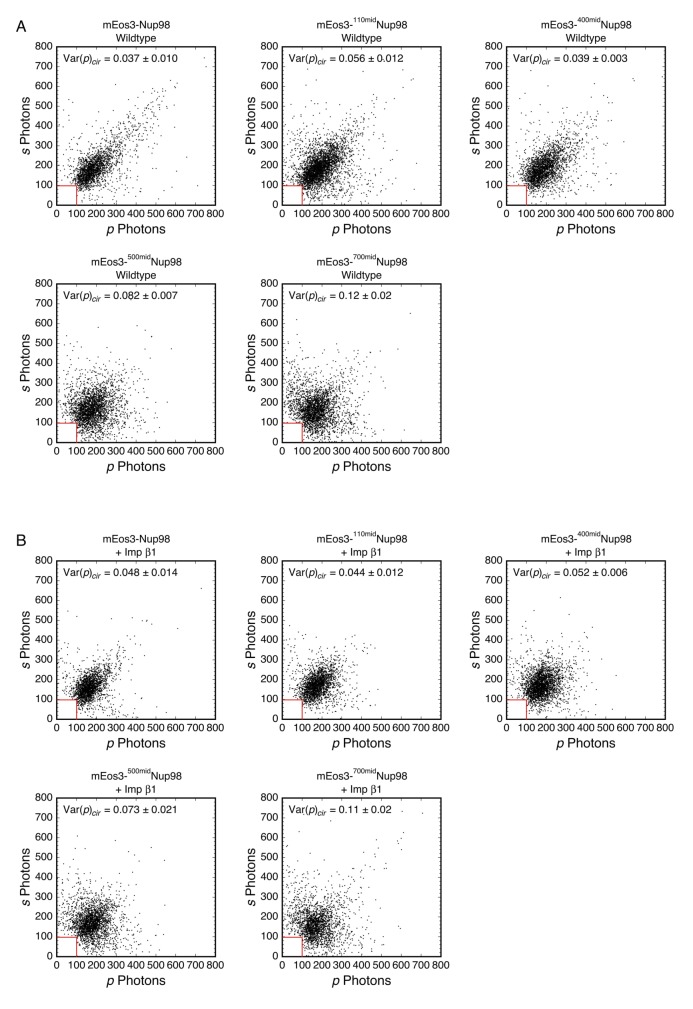
Figure 6—figure supplement 5. Photon scatterplots for data in Figure 5B (wt and +Imp β1).

Figure 6—figure supplement 5.

(A) mEos3-Nup98 middle mutants with no additions. (B) mEos3-Nup98 middle mutants + 10 µM Imp β1.
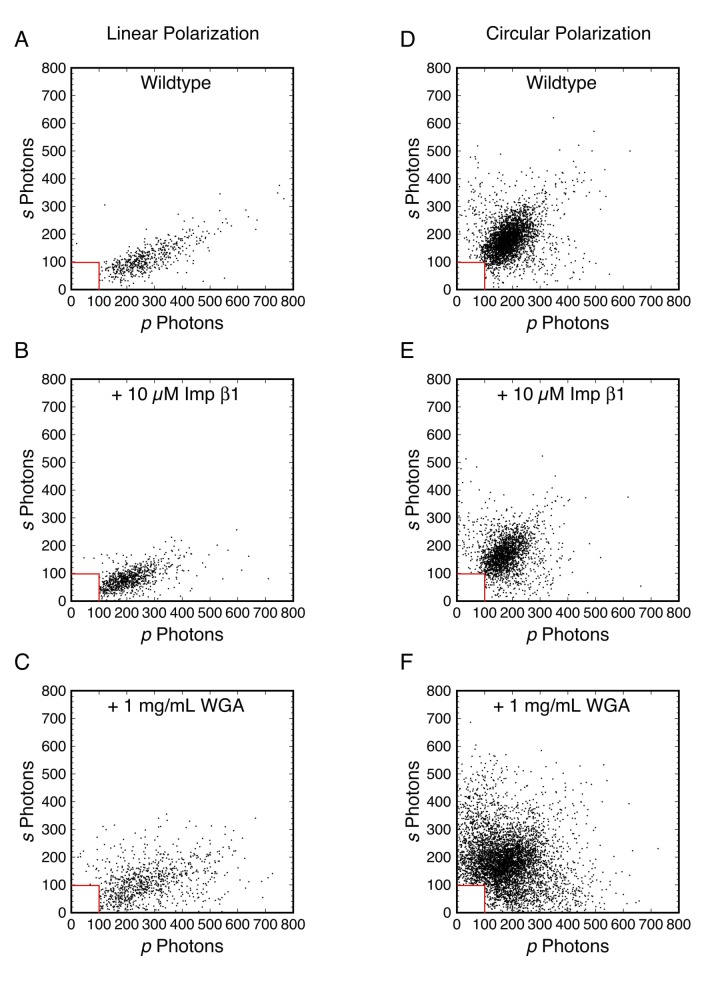
Figure 6—figure supplement 6. Photon scatterplots for the data in Figure 3.

Figure 6—figure supplement 6.

(A)-(F) correspond to Figure 3A–3F.
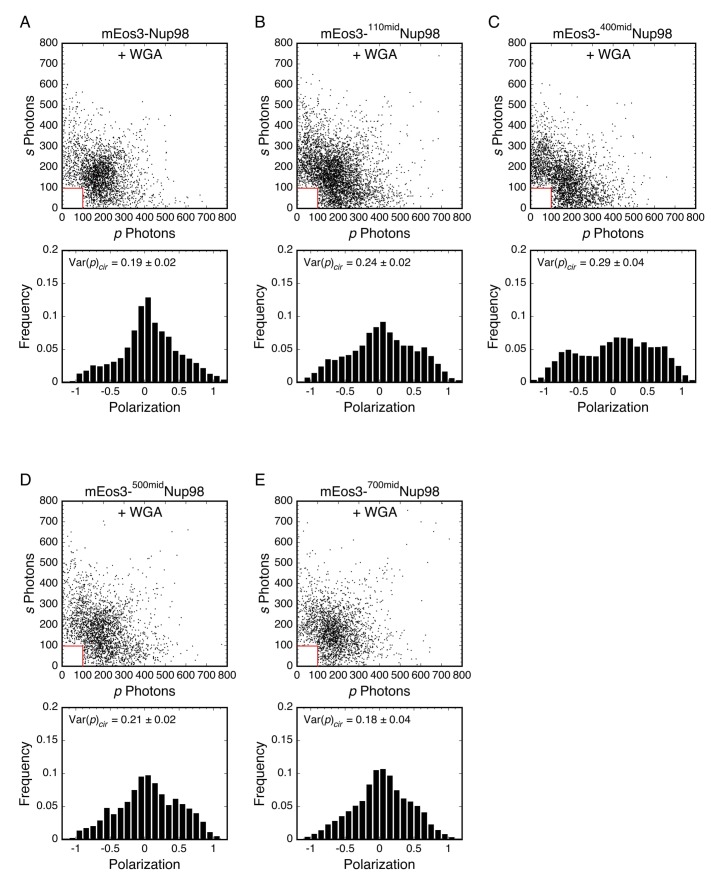
Figure 6—figure supplement 7. Photon scatterplots and polarization histograms for data in Figure 5B (+WGA).

Figure 6—figure supplement 7.

mEos3-Nup98 middle mutants + 1 mg/mL WGA.
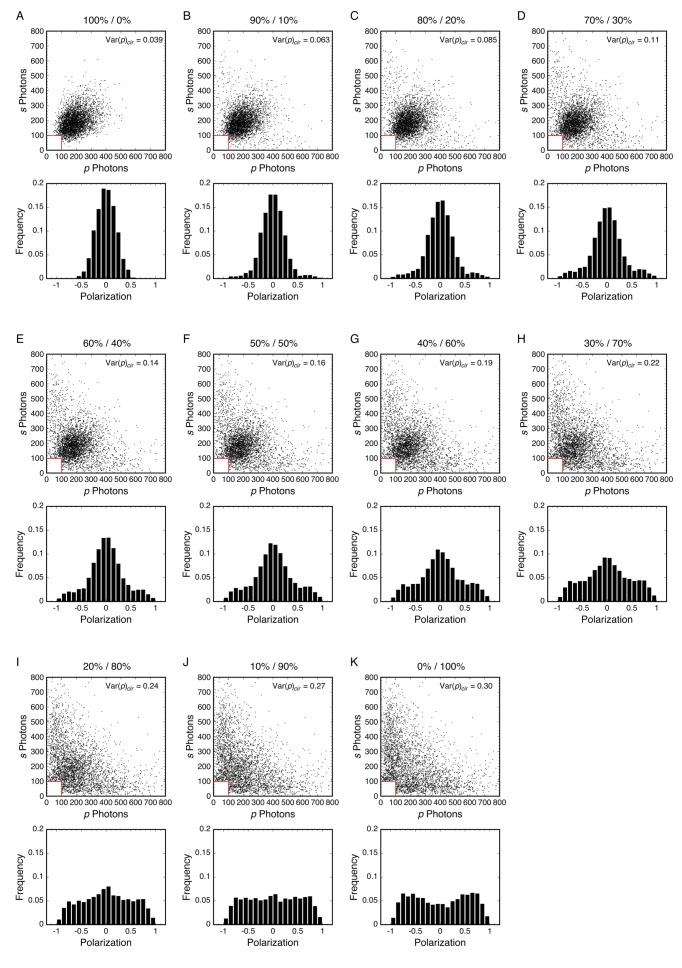
Figure 6—figure supplement 8. Mixed rotational mobility populations modeling mEos3-Nup98 middle mutants + WGA.

Figure 6—figure supplement 8.

Simulated photon scatterplots and polarization histograms are shown for mixed populations, assuming Dr,1 = 562 rad2/s (first %) or Dr,2 = 21.5 rad2/s (second %). Comparison with Figure 6—figure supplement 7 suggests that the experimental p-PALM data for the mEos3-Nup98 middle mutants with 1 mg/mL WGA can be explained by a mixture of two populations with different rotational mobilities. For all simulations, θobj = 50° (NAeff = 1.02; see Appendix 1—figure 4). N = 3369–3959; Nphotons = 389–437.