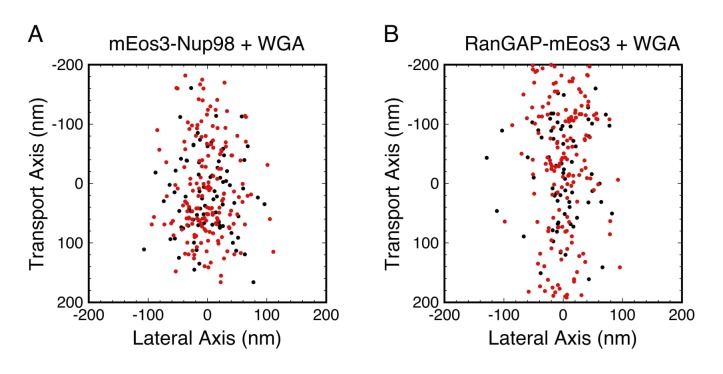
Figure 8. Combined PALM and p-PALM measurements of mEos3-Nup98 and RanGAP-mEos3 in the presence of WGA.
Data were collected as in Figure 7, except that the emission was divided into p- and s-polarization channels. Each dot corresponds to one image from one probe molecule. (red) 1.2 > |pcir| > 0.3, which is only expected for slowly rotating molecules with Dr < ~103 rad2/s; (black) |pcir| < 0.3, which could be observed for molecules with any Dr (see Figure 2C and D). The two color-coded populations have similar broad distributions in each panel, suggesting that WGA influences rotational mobility throughout most, if not all, of the FG-network. Total number of molecules and distribution widths (mean ± SD along the transport axis): (A) N = 359, (black) 17 ± 65 nm, (red) 5 ± 77 nm; (B) N = 386, (black) −8 ± 84 nm, (red) 21 ± 117 nm.

