
Extended Data Figure 10. Chromatin states of human PD1hi tumor-infiltrating CD8+ T cells and model for CD8 TST differentiation and dysfunction in tumors.
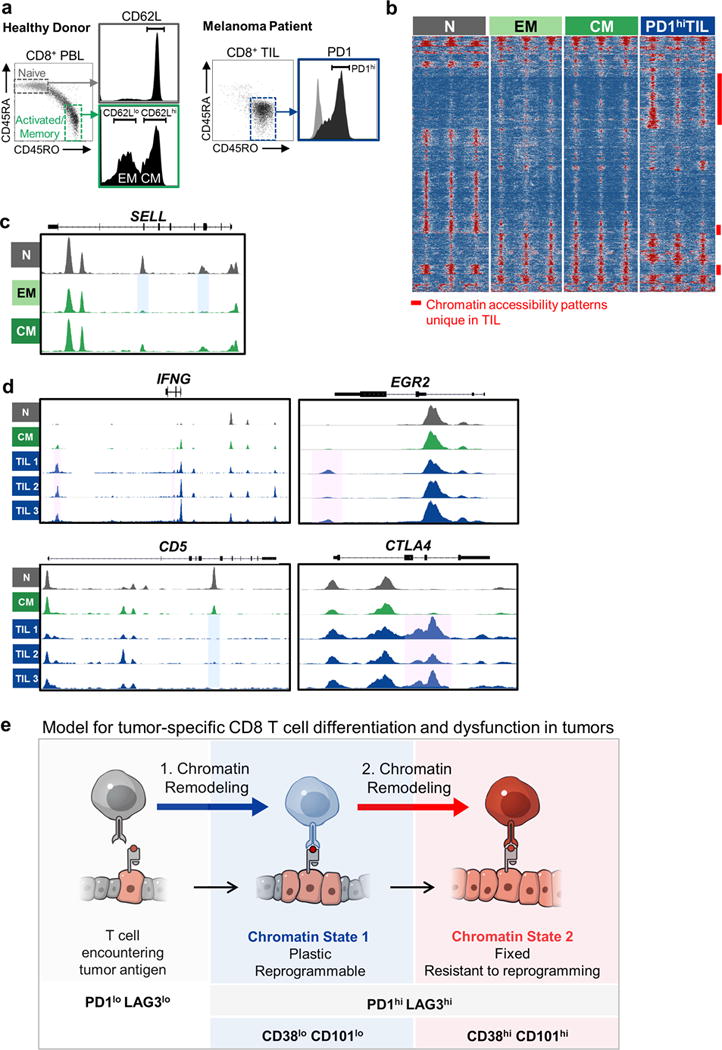
a, Sorting scheme of peripheral blood lymphocytes for Naïve (N), Effector Memory (EM), Central Memory (CM) CD8 T cell populations (left), and PD1hi CD8 TIL from melanoma and NSCLC patients. b, Differentially accessible ATAC-seq peaks grouped by DESeq-defined differential accessibility pattern. Each column represents one biological replicate. Samples shown include CD45RA+ CD45RO- (Naïve; N; grey), CD45RA- CD45RO+, CD62L- (Effector Memory; EM; light green) and CD45RA- CD45RO+, CD62L+ (Central Memory; CM; dark green) peripheral blood CD8+ T cells from healthy donors, and CD45RA- CD45RO+, PD1hi CD8+ T cells isolated and flow-sorted from human melanoma and lung tumors (PD1hi TIL; blue). Open, accessible chromatin regions are presented in red; inaccessible chromatin regions are presented in blue. c, ATAC-seq signal profiles of SELL in N, EM and CM. Blue boxes highlight peaks that remain accessible in CM or become inaccessible in EM compared to N respectively. d, ATAC-seq signal profiles of IFNG, EGR2, CD5, CTLA4. Pink and blue boxes highlight peaks that become accessible or inaccessible in PD1hi TIL compared to N or CM respectively. e, Model for tumor-specific CD8 T cell differentiation and dysfunction in tumors.