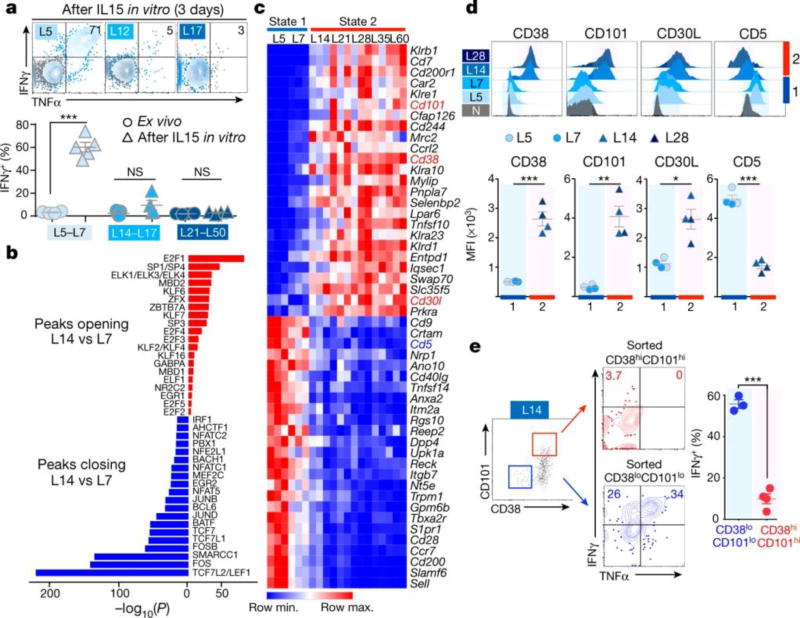
Figure 3. Discrete chromatin states correlate with reprogrammability and surface protein expression profiles.
a, (top) Cytokine production by L5, L12, and L17 after 3 days in vitro IL-15 culture (grey, no peptide control); (bottom) IFNγ production straight ex vivo (circles) or after 3–4 days IL-15 in vitro culture (triangles). Pooled from 3 experiments. b, Top 20 most-significantly enriched TF motifs in peaks opening (red) and closing (blue) between L7 and L14. c, RNA-Seq expression (row-normalized) for most differentially-expressed genes encoding membrane proteins. d, CD38, CD101, CD30L and CD5 expression. Representative of 3 independent experiments. e, Cytokine production by sorted CD38lo/CD101lo (blue) and CD38hi/CD101hi (red) L14 after 3 days IL-15 in vitro culture. Similar data obtained with sorted L10 in independent experiment. (a, d, e) Each symbol represents individual mouse. Mean ± s.e.m. shown; *P=0.005, **P=0.0005, ***P≤0.0001 (Student’s t-test).

