
Extended Data Figure 2. Fragment length distribution plots of ATAC-seq samples.
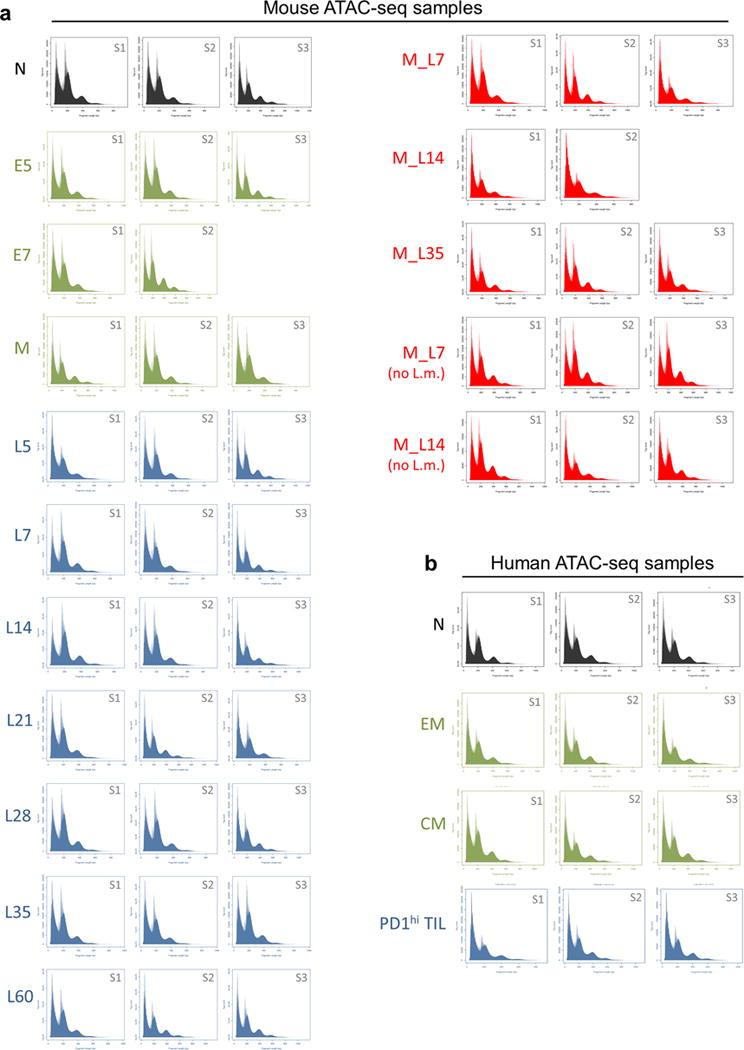
Plots are shown for all mouse (a) and human (b) CD8 T cell ATAC-seq samples displaying fragment length (bp; x-axis) and read counts (y-axis). (S1, S2, S3 = replicates per sample group).