
Extended Data Figure 8. Epigenetic and expression dynamics of membrane proteins and transcription factors associated with T cell dysfunction.
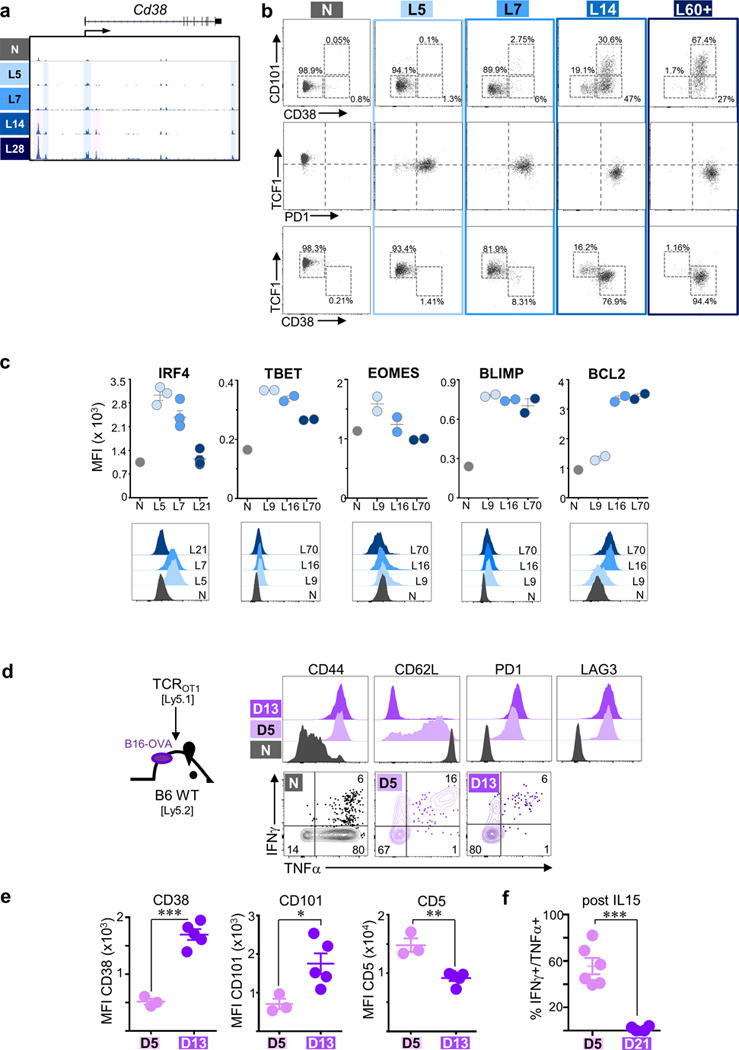
a, ATAC-Seq signal profile across the Cd38 loci with “state 2” uniquely accessible peaks highlighted in pink; activation-associated peaks highlighted in blue. b, Expression profiles of N, L5, L7, L14, and L60+ TCRTAG for CD101 versus CD38, TCF versus PD1, and TCF1 versus CD38 by flow cytometric analysis. c, Expression of transcription factors and other proteins on tumor-specific TCRTAG T cells over the course of tumorigenesis (MFI; mean fluorescence intensity). Each symbol represents an individual mouse. Data shows mean ± s.e.m. (bottom panel). Representative flow histogram overlays are shown. (d – f) TCROT1 TST in established B16-OVA tumors enter plastic and fixed dysfunctional states. d, Immunophenotype and cytokine production of TCROT1 re-isolated from established B16-OVA tumors 5 (D5) and 13 (D13) days post transfer. e, CD38, CD101 and CD5 expression on D5 and D13 TCROT-1. f, Cytokine production of D5 and D21 TCROT-1 after 3 days IL-15 in vitro culture. Each symbol represents individual mouse. Mean ± s.e.m. shown; *P=0.03, **P=0.002, ***P≤0.0003 (Student’s t-test).