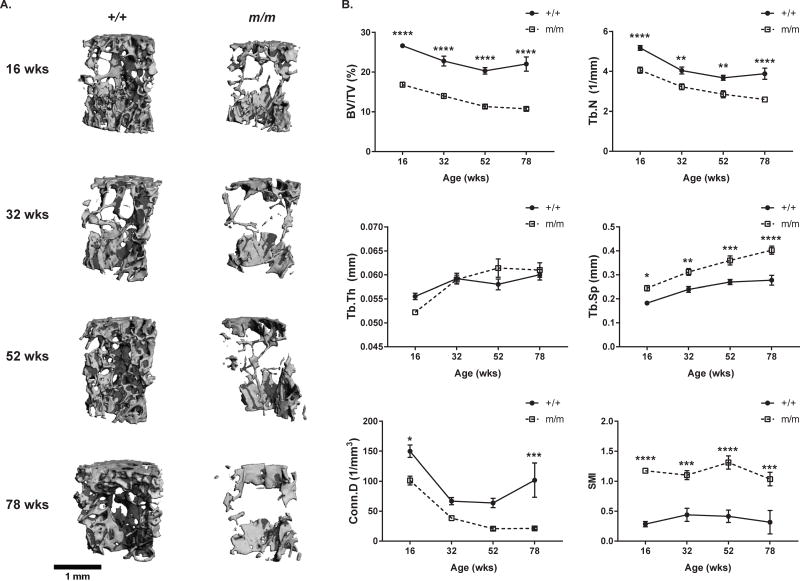
Figure 3. +/+ and m/m have similar trabecular bone loss in vertebrae with age.
(A) Representative images of L5 vertebrae, and (B) vertebral microarchitecture examined in +/+ and m/m from 16 to 78 wks of age. Trabecular microarchitecture was measured by μCT and bone volume/total volume (BV/TV), trabecular number (Tb.N.), trabecular thickness (Tb.Th), trabecular separation (Tb.Sp.), connectivity density (Conn.D.), and structural modeling index (SMI) were calculated. Closed circles (+/+) and open squares (m/m) represent mean ± SEM of n=8–10 per group. 2-way ANOVA: P <0.0001 for genotype in all measurements except Tb.Th. (not significant). Post hoc: *p<0.05, **p<0.01, ***p<0.001, ****p<0.0001 compared to +/+.

