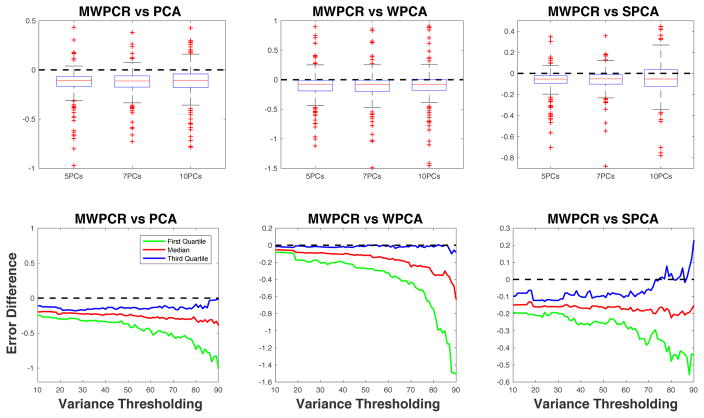
Figure 9.
ADAS-Cog Score Prediction for ADNI PET Data: comparison between MWPCR with PCA, WPCA, and SPCA. The panels in the first row show the boxplots of error differences between MWPCR and PCA (WPCA and SPCA) for different numbers of principal components. The panels in the second row show the first, second and third quantile curves of error differences between MWPCR and PCA (WPCA and SPCA) for different variance thresholds.

