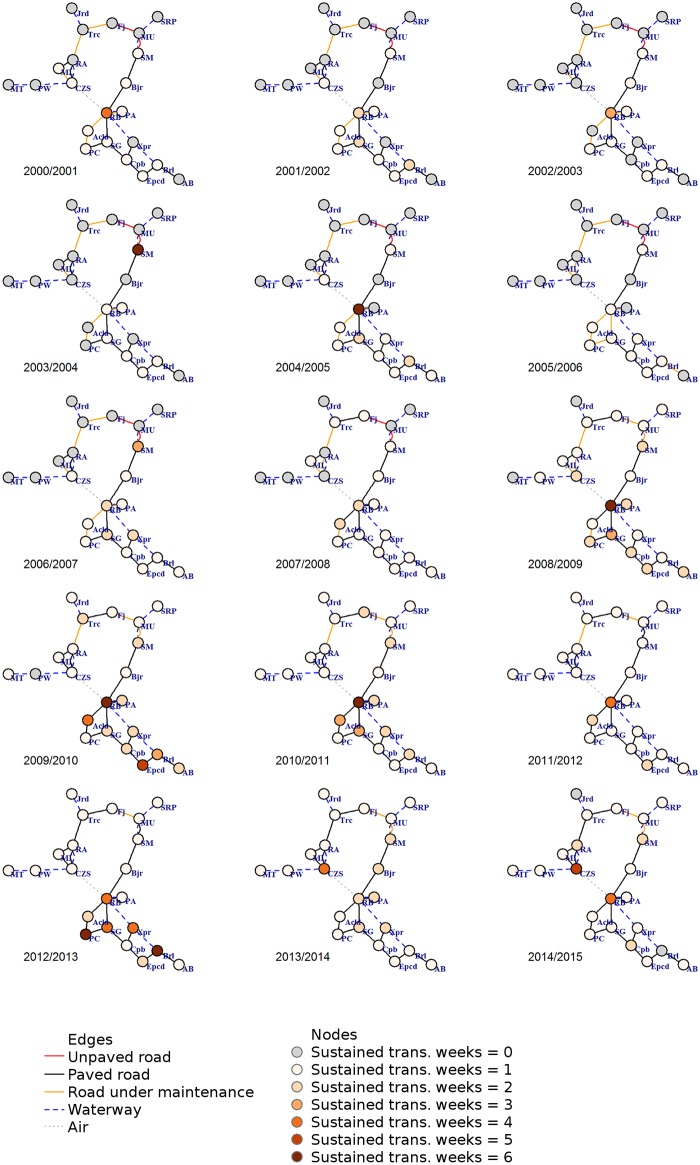
Fig 5. Structural networks time series in epidemiologic years.
Nodes (circles) are the 22 municipalities of the state of Acre in which gray nodes are municipalities with Rt < 1. Colored nodes are the representations of Rt > 1 by the number of consecutive weeks per year, varying in shades of orange for at least one week (lighter) to six consecutive weeks (darker), with gray color for years with no such event in any week. Edges (lines) are the direct connections between municipalities by modal type category: roads (unpaved in red, paved in black, under maintenance or construction in orange), waterway in dark blue dashed line and air in dotted gray line. This figure is provided in higher resolution in supplementary information S1 Fig.

