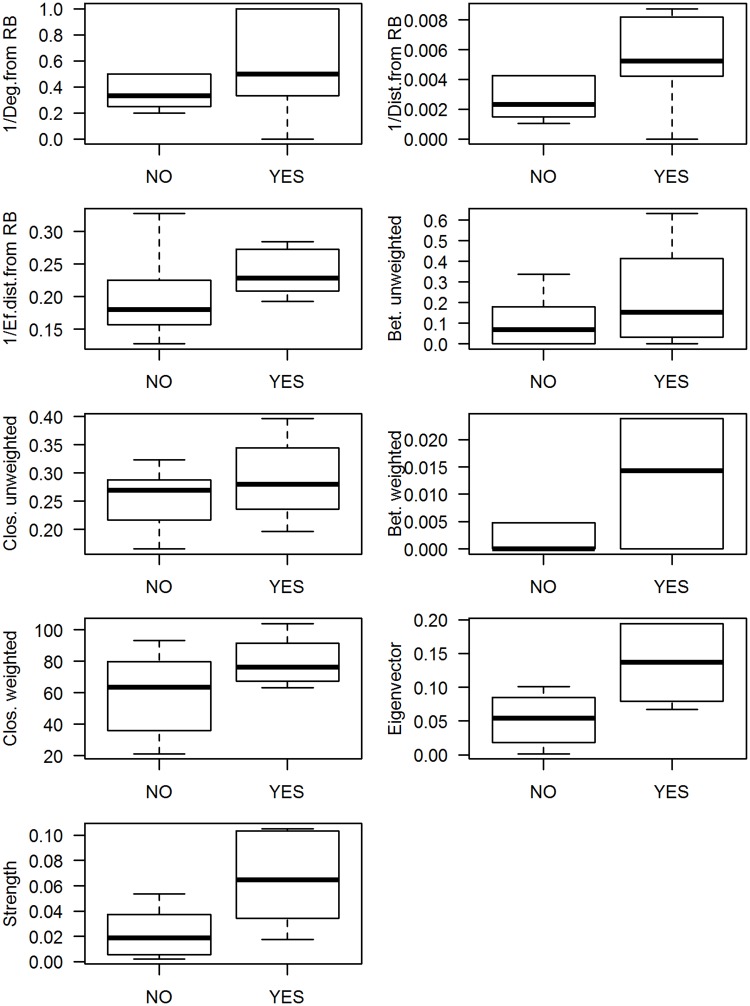
Fig 6. Centrality measures and dengue establishment.
Boxplots comparing the network descriptors of municipalities that witnessed dengue establishment during the study period and those which did not (Yes/No). Values for each Municipality are available in S2 Appendix.

