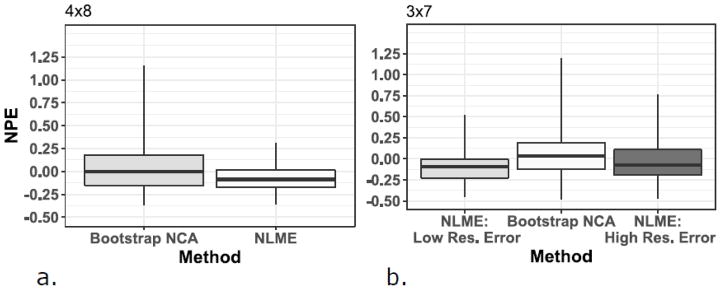
Figure 3.
Figure 3a and 3b. Boxplots of the normalized prediction error (NPE) by estimation method and sparse tissue sampling design. NLME results are divided into low and high residual error (Res.) for the 3×7 design. Data are presented as median (midpoint), interquartile range (box), and range (whiskers). NLME: Nonlinear Mixed Effects Modeling; NCA: noncompartmental analysis

