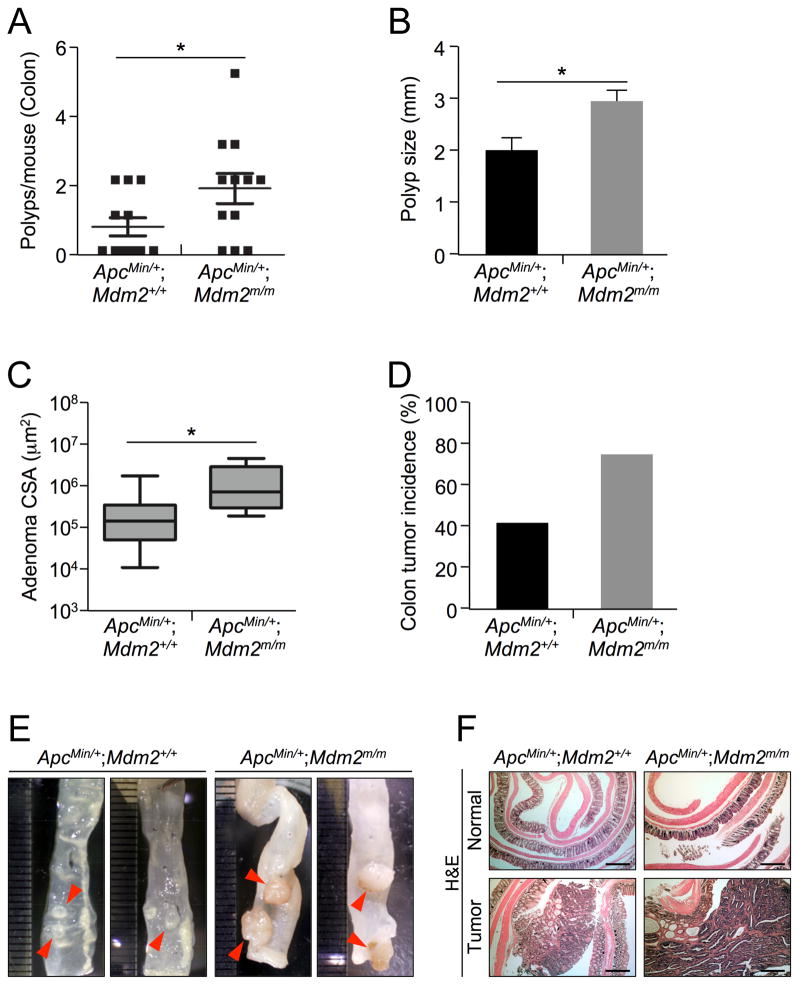
Figure 2. MDM2C305F mutation increases prevalence of APC loss-induced colon cancer.
A. Colon tissue was isolated from 15 week-old mice, and polyp numbers per mouse were counted under a dissection microscope. Error bars, ±SEM; *P<0.05.
B. The average size of colonic polyps in each genotype (n=12 mice). Apcmin/+; Mdm2m/m mice had significantly more large (>4mm) polyps. Error bars, ±SEM; *P<0.05.
C. The average cross sectional areas (CSA) of H&E stained colon adenomas were determined quantitatively using ImageJ. Error bars, ±SEM; *P<0.05.
D. The incidence of colon tumors in each genotype (n=12), measured by percentage of mice with observed colon tumors.
E. Pictures show the colonic polyps from Apcmin/+; Mdm2+/+ or Apcmin/+; Mdm2m/m mice under a dissection microscope. Adenomas from Apcmin/+; Mdm2m/m mice appeared significantly larger.
F. Representative H&E stained sections from Apcmin/+; Mdm2+/+ or Apcmin/+; Mdm2m/m mouse colon (Normal) and colon adenoma (Tumor) tissue. Scale bar = 500μm.

