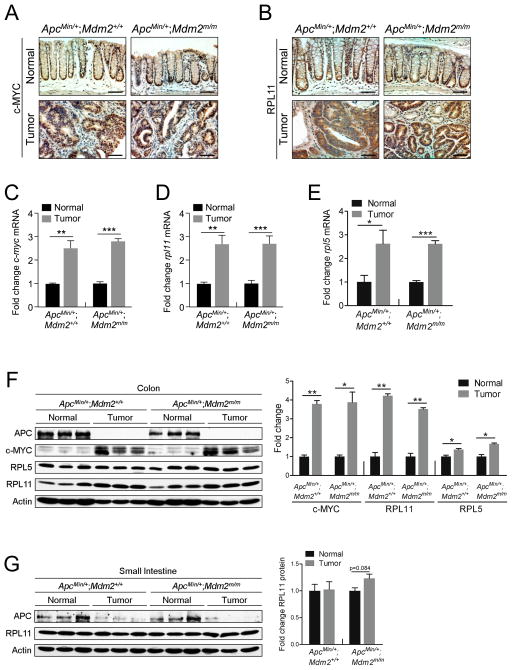
Figure 4. APC loss-induced colon cancers express high levels of c-MYC and RPL11.
A. IHC staining was performed in colon (Normal) and colonic adenomas (Tumor) to detect the expression of c-MYC. Scale bar = 75μm.
B. IHC staining was performed in colon (Normal) and colonic adenomas (Tumor) to detect the expression of RPL11. Scale bar = 75μm.
C. qPCR analysis of mRNA expression of c-myc in colon (Normal) or colonic adenomas (Tumor) from Apcmin/+; Mdm2+/+ and Apcmin/+; Mdm2m/m mice. n=3 for each genotype. Error bars, ±SEM; **P<0.01, ***P<0.001.
D. qPCR analysis of mRNA expression of rpl11 in colon (Normal) or colonic adenomas (Tumor) from Apcmin/+; Mdm2+/+ and Apcmin/+; Mdm2m/m mice. n=3 for each genotype. Error bars, ±SEM; **P<0.01, ***P<0.001.
E. qPCR analysis of mRNA expression of rpl5 in colon (Normal) or colonic adenomas (Tumor) from Apcmin/+; Mdm2+/+ and Apcmin/+; Mdm2m/m mice. n=3 for each genotype. Error bars, ±SEM; *P<0.05, ***P<0.001.
F. Western blotting analysis of protein lysates isolated from colon (Normal) or adjacent colonic adenomas (Tumor) with three mice per genotype. APC expression was undetectable in colonic adenomas, implying the loss of both wild type alleles. The bar graph illustrates the quantification of the western blot. Error bars, ±SEM; *P<0.05, **P<0.01.
G. Western blotting analysis of protein lysates isolated from small intestine (Normal) or adjacent adenomas (Tumor) with three mice per genotype. c-MYC expression was undetectable in small intestinal tissue. The bar graph illustrates the quantification of the western blot. Error bars, ±SEM.

