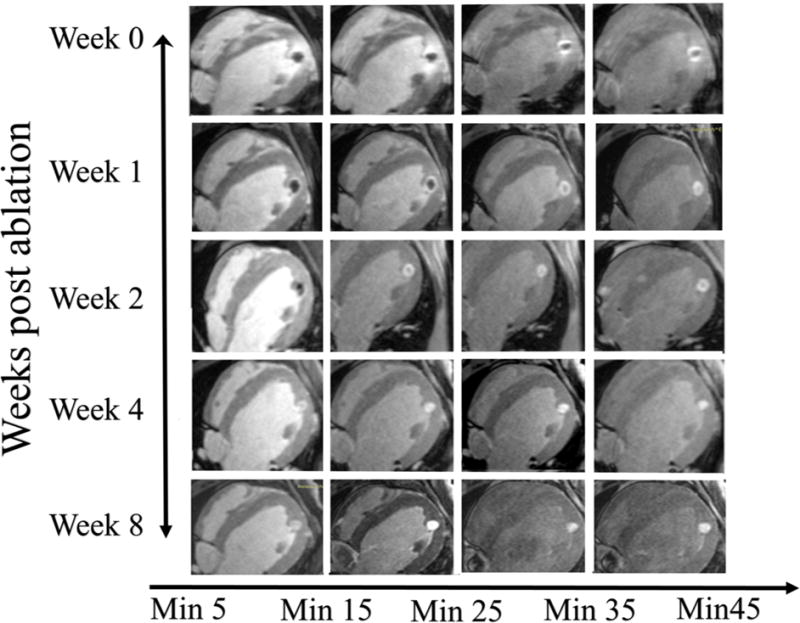
Figure 3.

An example of the appearance of a lesion on the LGE MRI at different time points (Week 0, 1, 2, 4 and 8) and with different delays between contrast injection and image acquisition. On week 0 images have edema, enhanced and MVO regions. Edema starts to fade with delay after contrast injection while the enhanced and MVO areas are still clearly visible even after 45 mins since contrast injection. At week 1, the there is no edema and MVO volume decreases faster with time delay after contrast injection as compared to week 0. At week 2, the MVO region decreases even faster and is completely enhanced in 30 mins. By week 4 and 8 there is no MVO and lesion fully enhances as contrast is injected.
