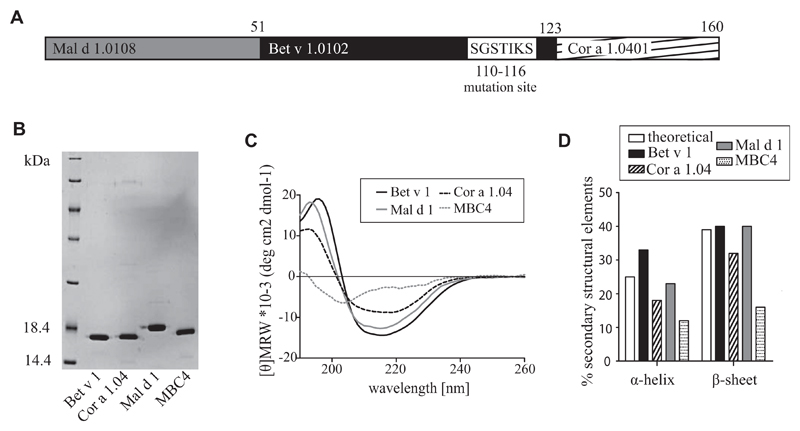
Fig 1.
A, Schematic representation of MBC4 sequence. B, Coomassie-stained 15% SDS-PAGE of purified proteins. One microgram per lane was loaded. C, CD spectra of parental allergens compared with MBC4 were recorded at 20°C and are presented as mean residue molar ellipticity after baseline correction. D, Fourier transform infrared spectra recorded at 20°C were used to calculate secondary structure elements.

