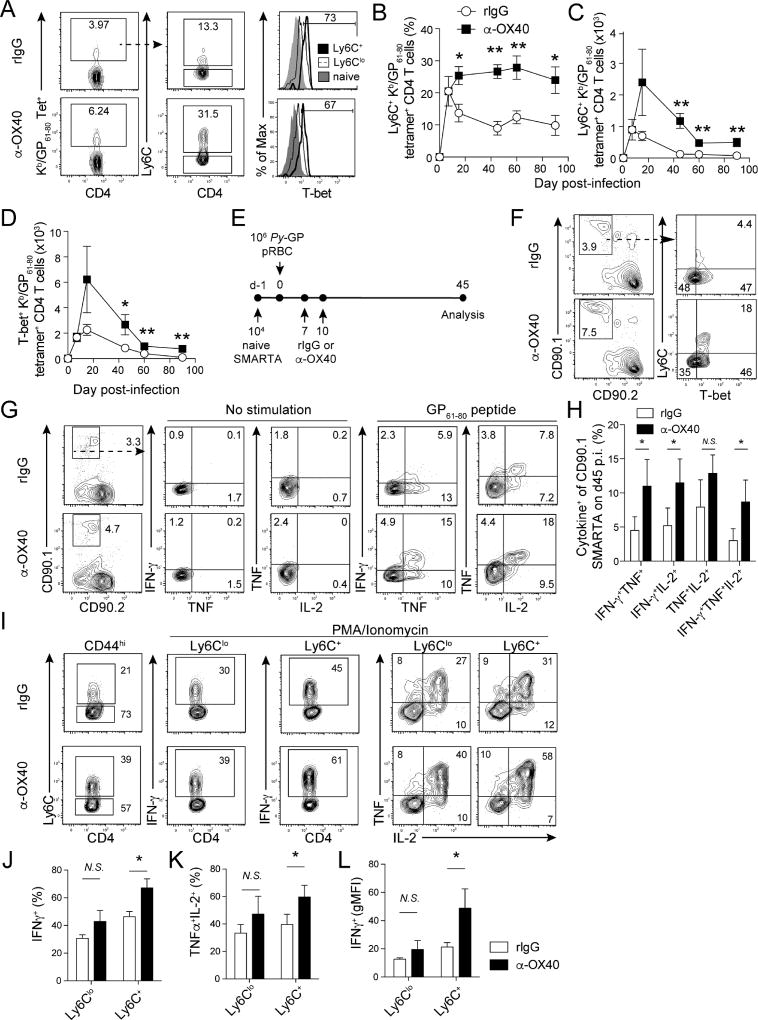
Figure 2. Therapeutic ligation of OX40 during primary P. yoelii infection induces T-bet expression and expands polyfunctional Ly6C+ Th1-like memory CD4 T cell populations.
(A–D). Mice were infected with 1×10⁶ transgenic Py-GP and administered either control rIgG or agonistic α-OX40 antibodies on days 7 and 10 p.i.
(A) Proportions of Ly6C+ GP61–80-specific CD4 T cells and their expression of T-bet relative to Ly6Clo GP61–80-specific CD4 T cells on d14 p.i.
(B–D) Kinetics of the proportion (B) and total number (C) of Ly6C+ GP61–80-specific CD4 T cells and total number of T-bet+ (D) GP61–80 -specific CD4 T cells in rIgG- and α-OX40-treated mice.
(E) Experimental design. 10,000 naïve CD90.1+ SMARTA CD4 T cells were transferred to naïve CD90.2+ mice. Recipients were infected with Py-GP and treated with either agonistic α-OX40 or control IgG antibodies on d7 and 10 p.i.
(F) Proportions of Ly6C+T-bet+ memory SMARTA cells on day 45 p.i.
(G) Proportions of memory SMARTA cells expressing IFN-γ, TNF, and IL-2 on day 45 p.i.
(H) Summary of cytokine profiles of memory SMARTA cells from rIgG- and α-OX40-treated mice on day 45 p.i.
(I–L) Expression of Ly6C (I), IFN-γ (I,L), and IL-2/TNF (K) by total polyclonal (CD44hi) memory CD4 T cells on day 45 p.i.
Data (Mean +/− SEM) in (B–D) are pooled from 2–3 independent experiments per time point with 3–5 mice/group per experiment and were analyzed using multiple Student’s t tests while correcting for multiple comparisons using the Holm-Sidak method. Data (Mean +/− SD) in (H–L) derive from 4–5 mice/group and are representative of two independent experiments. *p<0.05 **p<0.01 N.S. = not significant. See also Figure S2

