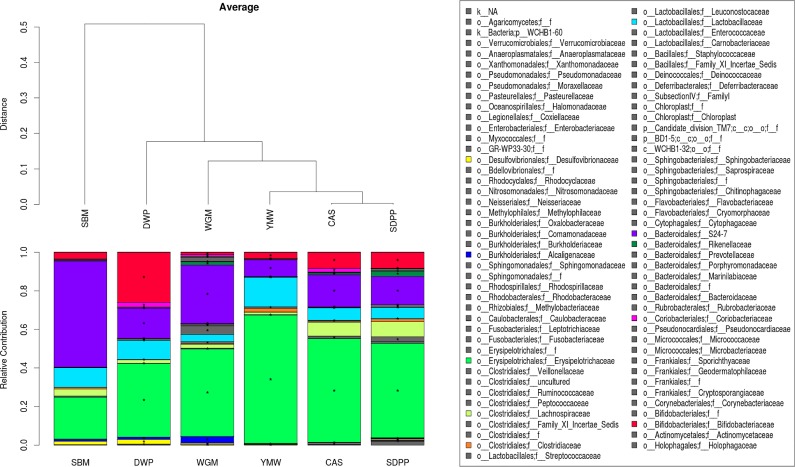
Fig 2. The ileal microbiome composition profiles based on the relative abundance at the family level.
Bacterial families are represented with different colors (shown in key). Hierarchical clustering of the microbial family composition is indicated above the composition profile. * Represents significant difference (P < 0.05) of microbiota at family level compared to SBM-fed mice. Members of microbial family belonging to ‘others’ are listed in S3 Table. SBM, soybean meal; CAS, casein; DWP, partially delactosed whey powder; SDPP, spray dried porcine plasma; WGM, wheat gluten meal and YMW, yellow meal worm.

