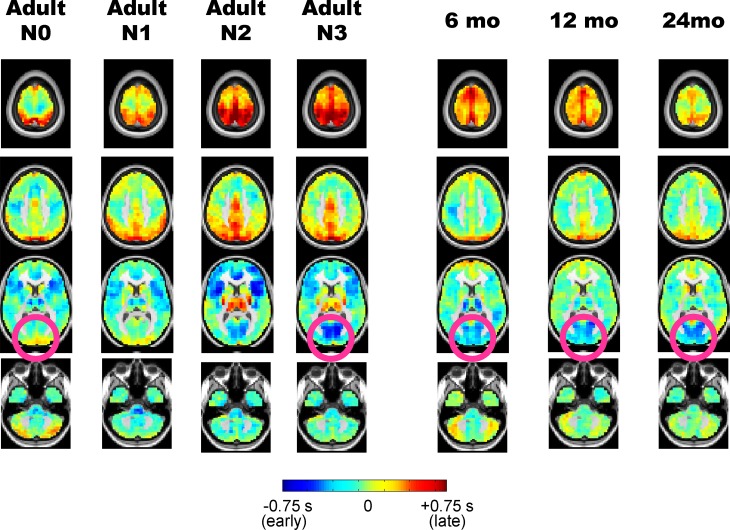
Fig 3. Propagation analysis of the resting-state fMRI BOLD signal in adult sleep and early childhood.
Columns show temporal lag projection maps in adult wake/sleep stages as well as in children aged 6–24 months. Blue colors indicate regions where spontaneous BOLD signal activity tends to be early with respect to the rest of the brain; red colors indicate regions which tend to be late with respect to the rest of the brain. Pink circles contrast visual earliness in adult N3 sleep and infants against adult N0 wake.

