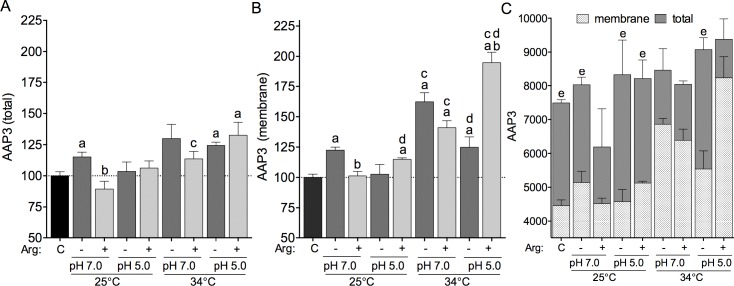
Fig 3. Shift in pH, temperature and L-arginine availability influences AAP3 protein expression and intracellular organization.
AAP3 protein expression was determined after starvation or supplementation with 400 μM L-arginine at 25 and 34°C, and in pH 5.0 and pH 7.0. (A) Fluorescence detection of AAP3 protein on the permeabilized parasites. (B) Fluorescence detection of AAP3 protein on the plasma membrane of non-permeabilized parasites. (C) Absolute quantification of cells and comparison of plasma membrane and total AAP3 protein. (a) p < 0.05, comparing the control and the changed conditions of starvation (-) or L-arginine supplementation (+) at 25°C or 34°C and in pH 5.0 or pH 7.0. (b) p < 0.05, comparing the changed conditions of starvation or L-arginine supplementation. (c) p < 0.05, comparing the changed conditions at 25°C or 34°C in pH 5.0 and pH 7.0. (d) p < 0.05, comparing the changed conditions at 25°C and 34°C in pH 5.0 or pH 7.0. (e) p < 0.05, comparing the membrane AAP3 to total AAP3. The values are the mean ± SEM of 4–6 independent biological replicates. (C) Control parasites were collected before amino acid starvation and/or L-arginine supplementation.

