
Fig. 4.
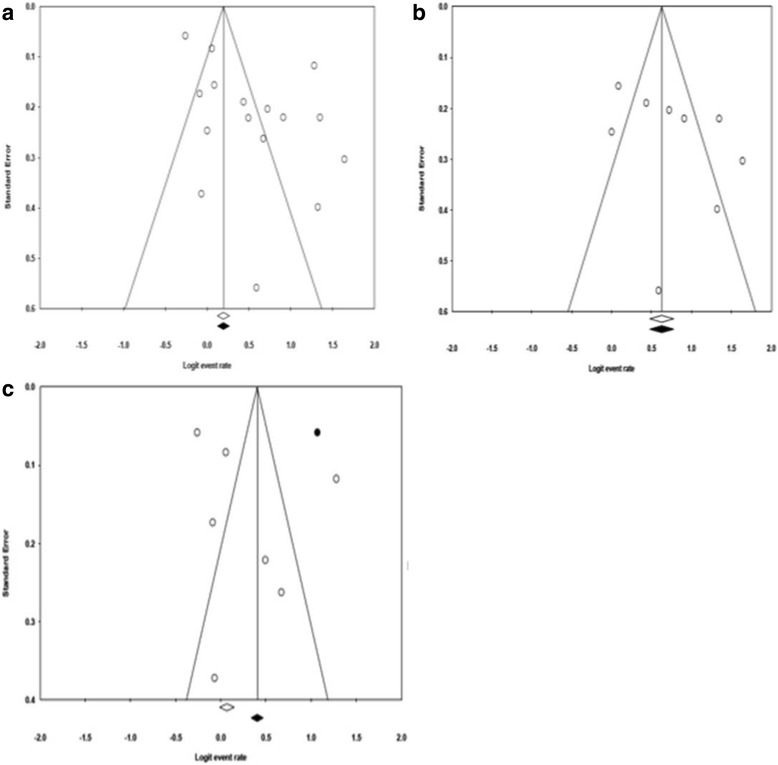
Illustration of funnel plot asymmetry due to heterogeneity. The figure shows the Funnel plot of standard error by logit event rate for all studies (a), community based studies (b), and hospital based studies (c)
Official websites use .gov
A
.gov website belongs to an official
government organization in the United States.
Secure .gov websites use HTTPS
A lock (
) or https:// means you've safely
connected to the .gov website. Share sensitive
information only on official, secure websites.
Illustration of funnel plot asymmetry due to heterogeneity. The figure shows the Funnel plot of standard error by logit event rate for all studies (a), community based studies (b), and hospital based studies (c)