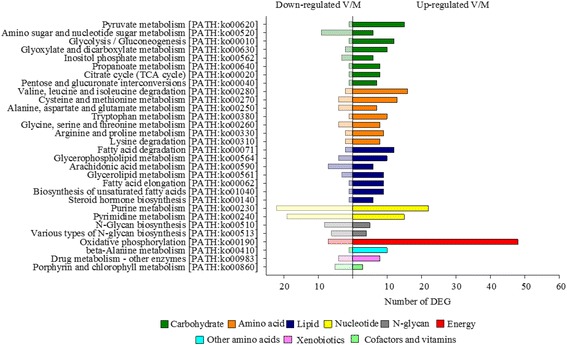
Fig. 4.

KEGG pathway analysis of genes belonging to the metabolism category that were regulated by diet as indicated by two-way ANOVA analysis. Bars represent number of up- and down-regulated genes in fish fed diet V versus diet M during early development. Different colours indicate different nutrient groups
