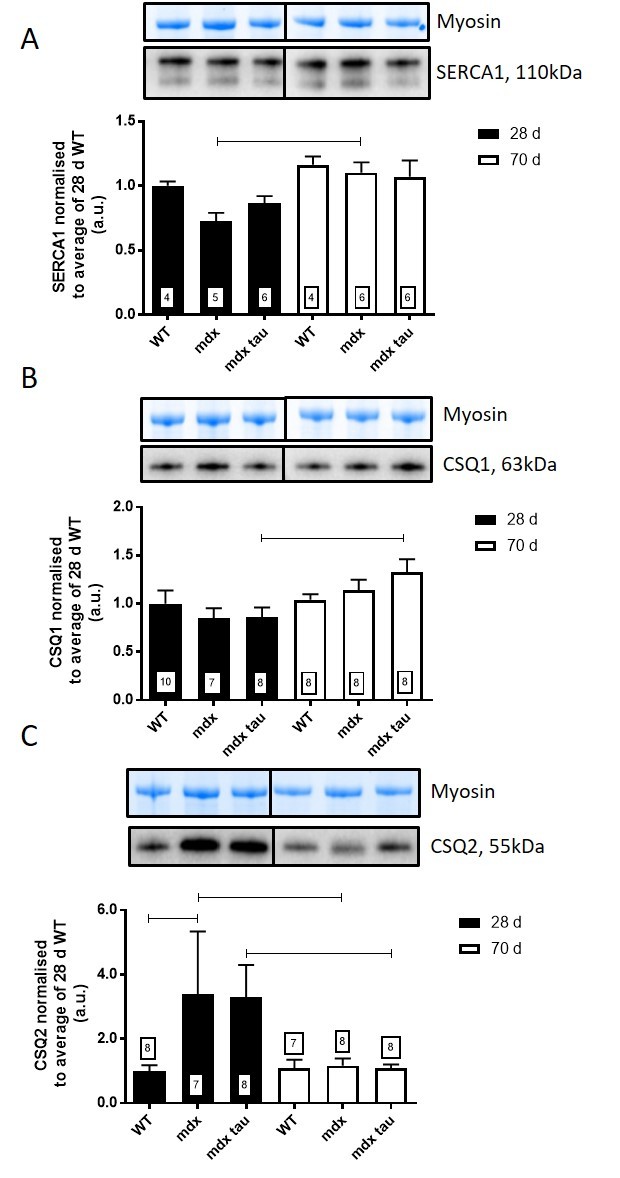
SERCA1 and calsequestrin in 28 and 70 d WT, mdx and mdx tau mice.

Shown for each panel is the myosin from the Stain Free gel, indicative of total protein (top) and the representative Western blot protein (middle) and quantification of the abundance of SERCA1 (A), CSQ1 (B) and CSQ2 (C) in TA muscle from 28 d (black bars) and 70 d (white bars) WT, mdx and mdx tau mice expressed relative to the 28 d WT. One way ANOVA with Sidak’s post-hoc analyses between relevant groups. Data presented as means + SD with n indicated in respective bars. Lines connecting different bars indicate significance at p<0.05.
