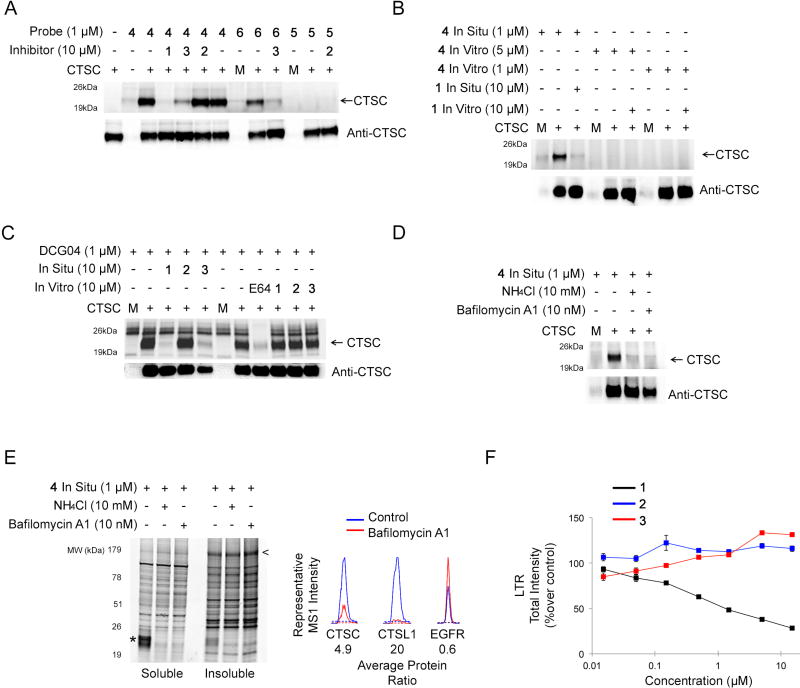
Figure 4. Characterization of Cathepsin Off-Targets and Lysosomotropic Activity of Inhibitor 1/Probe 4.
(A) Characterization of CTSC as a specific off-target of inhibitor 1/probe 4. HEK293T cells recombinantly expressing CTSC were treated in situ with inhibitors (1–3; 10 µM, 2 hr) followed by probes (4–6; 1 µM 4 hr) and the soluble lysate was analyzed by gel-based ABPP (upper panel). Anti-CTSC western blotting was used to confirm equivalent protein expression in the samples (lower panel). Representative full-length labeled gel for CTSC is shown in Figure S5A. Mock transfected lanes are marked with the letter M.
(B) Comparing in vitro versus in situ reactivity of probe 4 with CTSC. HEK293T cells recombinantly expressing CTSC were treated in situ (inhibitor 1: 10 µM, 2 hr; and/or probe 4: 1 µM, 4 hr) or in vitro (inhibitor 1: 10 µM, 1 hr; followed by probe 4: 5 µM, 1 hr or 1 µM, 3 hr) and analyzed by gel-based ABPP (upper panel). Anti-CTSC western blotting was used to confirm equivalent protein expression in the samples (lower panel).
(C) Competitive ABPP of CTSC in vitro versus in situ with inhibitor 1–3 using the cathepsin-directed activity-based probe DCG-04. HEK293T cells recombinantly expressing CTSC were treated in situ with inhibitors 1–3 (10 µM, 2 hr) or in vitro with inhibitors 1–3 (10 µM, 1 hr) or E64 (10 µM, 1 hr) followed by DCG-04-rhodamine labeling in vitro (1 µM, 30 min) and analyzed by gel-based ABPP (upper panel). Anti-CTSC western blotting was used to confirm equivalent protein expression in the samples (lower panel). Mock transfected lanes are marked with the letter M.
(D) In situ reactivity of CTSC with probe 4 post-lysosomal neutralization. HEK293T cells recombinantly expressing CTSC were treated with NH4Cl (10 mM, 15 min) or bafilomycin A1 (10 nM, 15 min) prior to treatment with probe 4 (1 µM, 4 hr), after which cells were lysed and analyzed by gel-based ABPP (upper panel). Anti-CTSC western blotting was used to confirm equivalent protein expression in the samples (lower panel). Mock transfected lanes are marked with the letter M.
(E) In situ reactivity of probe 4 post-lysosomal neutralization in H1975 cells. H1975 cells were treated with NH4Cl (10 mM, 15 min) or bafilomycin A1 (10 nM, 15 min) prior to probe 4 labeling in situ (1 µM, 4 hr) and analyzed by gel-based ABPP (upper panel). The T790M-EGFR band is denoted with an arrow (<) and the cathepsin band with an asterisk (*). Right panel, representative tryptic peptide MS1 ratios for the indicated proteins from ABPP-SILAC experiments evaluating probe 4 reactivity in bafilomycin- versus DMSO-treated H1975 cells. Complete MS data for bafilomycin-treated H1975 cells is displayed graphically in Figure S5G.
(F) LTR (LysoTracker Red) staining of H1975 cells treated with inhibitors 1–3. H1975 cells were treated with indicated concentrations of inhibitors 1–3 (2 hr) and LTR staining was quantified. Data represents average values + SEM for three independent experiments.
For (A–E), all gel-based ABPP experiments and western blots were performed in duplicate or triplicate with consistent results.

