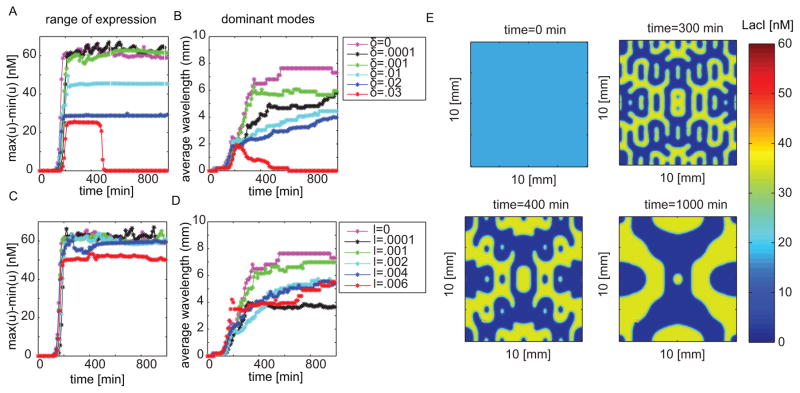
Figure 7. Leakiness and cross talk can help improve transient patterns observed.
All simulations where done with same parameters as Fig. 6 with initial conditions u(0, x, y) = v(0, x, y) = 100nM for fair comparison. (A) Range of expression as a function of time for various cross talk values. (B) Average of the dominant modes as a function of time for various cross talk values. (C) Range of expression as a function of time for various leakiness values. (D) Average of the dominant modes as a function of time for various leakiness values. (E) simulation with δ = .01 and l = .0001nM/min.

