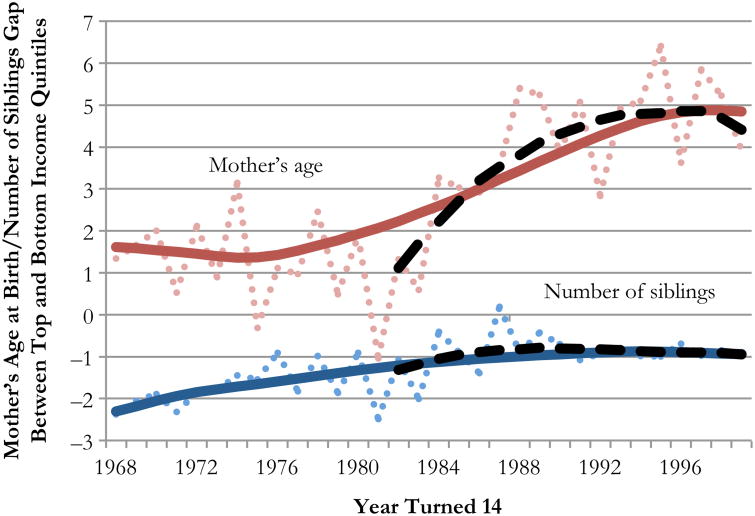
Fig. 6.
Top minus bottom income quintile differences in age of mother at birth and number of siblings: Panel Study of Income Dynamics. Dotted lines show gaps in mother's age at birth (top dotted line) and number of siblings (bottom dotted line) between children in the top and bottom quintiles of the income distribution for all PSID cohorts. Solid lines shows lowess-based trends across all years of data; dashed lines show lowess-based trend for data in the second half of the period

