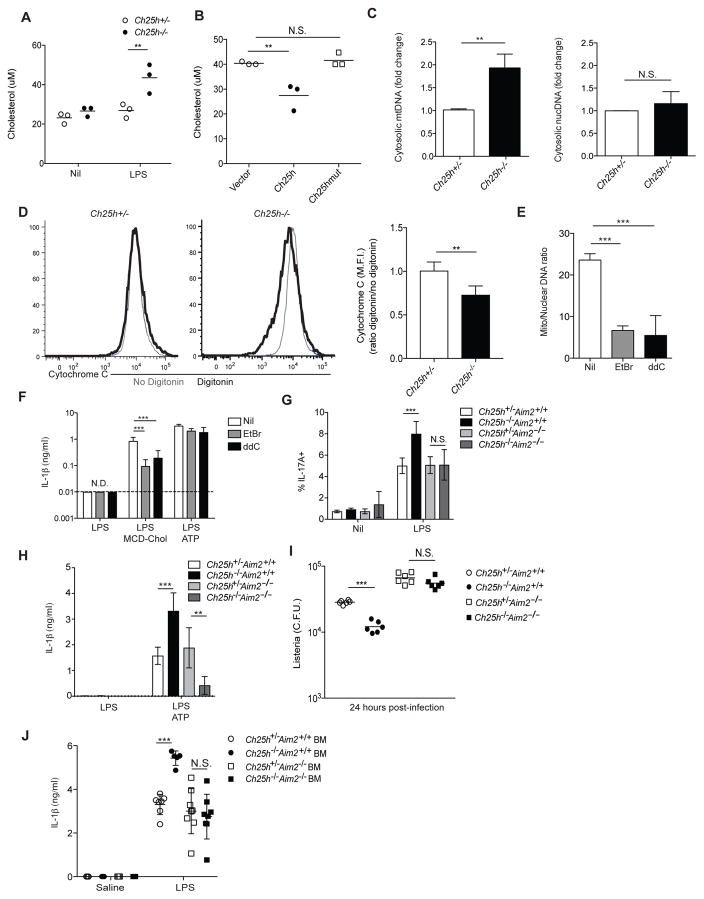
Figure 7. Cholesterol buildup in mitochondrial causes cytosolic release of mtDNA.
(A) Quantification of cholesterol in isolated mitochondria from Ch25h+/− and Ch25h−/− BMDMs either untreated or stimulated with LPS for 8 hr. Data from 3 independent experiments (mean+/−SD). (B) Quantification of cholesterol in Ch25h−/− BMDMs transduced with MSCV-vector, −Ch25h, or −Ch25hmut and treated for 8 hr with LPS. Data from three independent experiments (mean+/−SD). (C) mtDNA (Left) or nucDNA (Right) RT-qPCR from cytosolic extracts derived from Ch25h+/− and Ch25h−/− BMDMs treated as above. Data from 4 independent experiments (mean+/−SD). (D) Representation histograms (left) and summary graph (right) of intracellular cyt C staining in Ch25h+/− and Ch25h−/− BMDMs stimulated for 8 hr with LPS and either permeabilized with digitonin or not. Data from two independent experiments (mean+/−SD). (E) mtDNA RT-qPCR of total DNA extractions from BMDMs treated for 7 days with either nil, ethidium bromide (EtBr), or ddC. Data from 3 independent experiments (mean+/−SD). (F) IL-1β ELISA from supernatants of BMDMs depleted of mtDNA as described above, and stimulated with either LPS alone, LPS+MCD-Chol, or LPS+ATP. Data from 3 independent experiments (mean+/−SD). (G) IL-1β bioactivity detected as in Fig. 3 using supernatants from LPS-stimulated BMDMs of the indicated genotypes. Data from three independent experiments (mean+/−SD). (H) IL-1β ELISA of supernatants from BMDMs of the indicated genotypes stimulated with LPS or LPS+ATP. Data from three independent experiments (mean+/−SD). (I) L. monocytogenes CFU from BMDMs of the indicated genotypes infected for 24 hr. Data from three independent experiments (mean+/−SD). (J) IL-1β ELISA of serum from mice of the indicated genotypes injected with LPS (20mg/kg) I.V. for 8 hr. Data from three independent experiments (n = 5 to 8 mice per group, mean+/−SD). *P<0.05, **P<0.01, ***P < 0.005 (unpaired Students t test or one way ANOVA with bonferroni test). See also Figure S5.

