
Figure 4. Impact of duplex length and stability on unwinding by DDX3X.
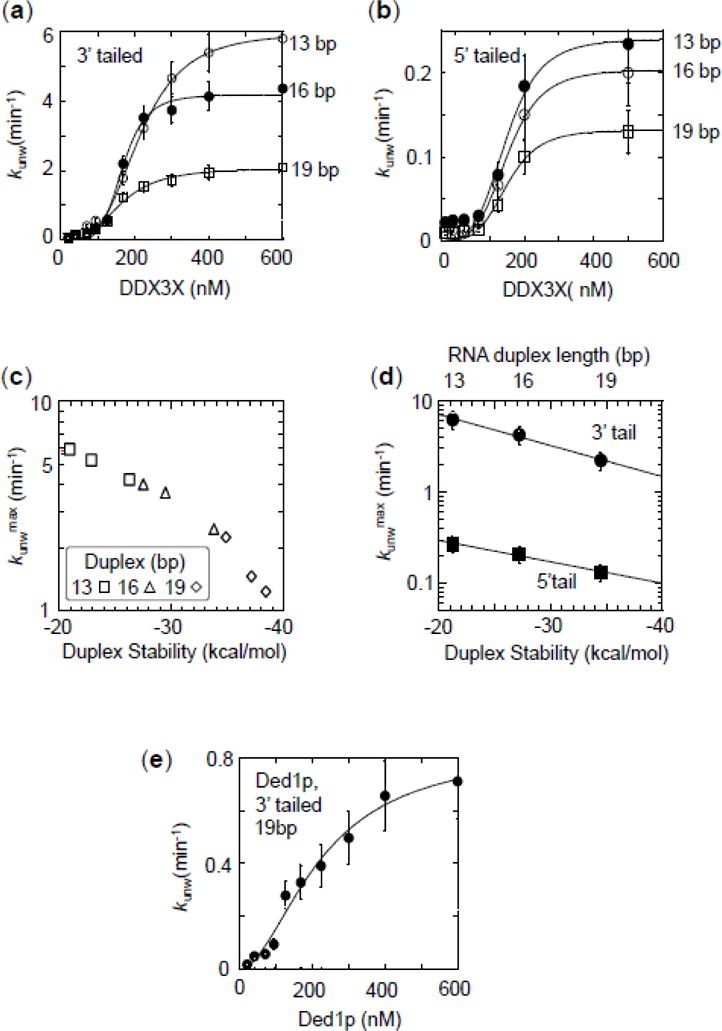
(a) Functional binding isotherms for DDX3X for substrates with 25 nt unpaired tails 3′ to duplexes with 13 (open circles), 16 (closed circles) and 19 bp (open squares). Data points represent averages of at least three independently measured unwinding rate constants, error bars mark one standard deviation. Lines show best fits to the Hill equation (K1/213bp = 165 ± 29 nM, H13bp = 3.1 ± 0.3, kunwmax(13bp) = 6.2 ± 0.2 min−1; K1/216bp = 118 ± 18 nM, H16 bp = 3.0 ± 0.2, kunwmax(16bp) = 4.2 ± 0.3 min−1; K1/219bp = 136 ± 30 nM, H19bp = 3.1 ± 0.2, kunwmax(19bp)= 2.1 ± 0.1 min−1).
(b) Functional binding isotherms for DDX3X for substrates with 25 nt unpaired tails 5′ to duplexes with 13 (open circles), 16 (closed circles) and 19 bp (open squares). Data points represent averages of at least three independently measured unwinding rate constants, error bars mark one standard deviation. Lines show best fits to the Hill equation (K1/213bp = 139 ± 21 nM, H13bp = 3.0 ± 0.2; kunwmax(13bp) = 0.29 ± 0.02 min−1; K1/216bp = 119 ± 35 nM, H16bp = 3.1 ± 0.2, kunwmax(16bp) = 0.21 ± 0.04 min−1; K1/219bp = 166 ± 18 nM, H19bp = 3.1 ± 0.3, kunwmax(19bp) = 0.13 ± 0.02 min−1).
(c) Correlation of maximal unwinding rate constants for 25 nt, 3′ tailed substrates with calculated duplex stabilities (x-axis) and duplex length (inset). For sequences of the substrates see Table 1, Materials and Methods. Data points represent averages of at least three independently measured maximal unwinding rate constants (kunwmax) at enzyme saturation, error bars one standard deviation. RNA stability was calculated according to Mathews et al. (52). Note the logarithmic scale of the y-axis. Data points represent kunwmax and RNA stability (ΔG) for individual substrates, as indicated in the inset.
(d) Dependence of maximal unwinding rate constants for DDX3X (circles: 25 nt 3′ tails, squares 25 nt 5′ tails). Data points represent rate constants reported in panels (a) and (b). Error bars mark the standard error for the respective calculated maximal rate constant. Note the logarithmic scale of the y-axis. Lines mark linear trends.
(e) Functional binding isotherms for Ded1p for the substrates with 19 bp (25 nt, 3′ tail). Data points represent averages of at least three independently measured unwinding rate constants, error bars mark one standard deviation. The line shows the best fit to the Hill equation (K1/2 = 175 ± 12 nM, kunwmax = 0.7 ± 0.1 min−1, H = 3.6 ± 0.3)